Appearance
Ecomap Guide
An ecomap is a diagram that shows how a person or family connects to the world around them; schools, employers, healthcare providers, extended family, community organizations, and sources of both support and stress.
It was developed by social worker Ann Hartman in 1978 and has been used in social work, nursing, and family therapy ever since. For the full background, see ecomap history.
Where a genogram maps the family's internal history across generations, an ecomap maps the environment the family currently lives in. The two tools are often used together.
What an Ecomap Shows
An ecomap answers a specific question: who and what does this person or family rely on, and how strong are those connections right now?
It shows:
- Which external systems the family is connected to.
- Whether each connection is strong, weak, or stressful.
- Which direction support flows; toward the family, away from it, or both ways.
- Where gaps in support exist.
What it doesn't show: family history, generational patterns, health conditions, or the internal relationships between family members.
What Goes in an Ecomap
An ecomap has two parts:
The center contains the family or individual being assessed. This is usually a circle with the family members' names inside. If the family has already been mapped in a genogram, a simplified version of that structure goes in the center.
The outer circles each represent an external system the family interacts with. Common ones include:
- Extended family (relatives outside the immediate household)
- Friends and neighbors
- Healthcare providers
- School or childcare
- Employer or workplace
- Faith community
- Community organizations (food banks, support groups, recreational clubs)
- Social services or housing authorities
Not every circle needs to be present. Only include systems that are actually part of the family's life.
The lines connecting the center to each outer circle show the nature of the relationship:
- Thick or double solid line - strong, positive connection.
- Thin dashed line - weak or underused connection.
- Zigzag or jagged line - stressful or conflictual relationship.
Directional arrows on the lines show which way support flows:
- Arrow pointing toward the center - support comes from that system to the family.
- Arrow pointing away - the family gives support to that system.
- Double-headed arrow - mutual, reciprocal support.
Ecomap Symbols and Meanings
- Large circle in center - Family or individual being assessed.
- Smaller outer circles - External systems.
- Thin dashed line - Weak or distant connection.
- Zigzag line - Stressful or conflictual relationship.
- Arrow → toward center - Support flows to the family.
- Arrow → away from center - Support flows from the family.
- Double arrow ↔ - Mutual support
Always include a key on the finished diagram. Anyone reading the ecomap without context needs to be able to interpret the symbols without asking.
An Ecomap Example: The Nash Family
Sarah Nash is a 34-year-old single mother with two children: Jake, 10, and Lucy, 7. A social worker is completing an ecomap at intake to assess the family's current support network before planning interventions.
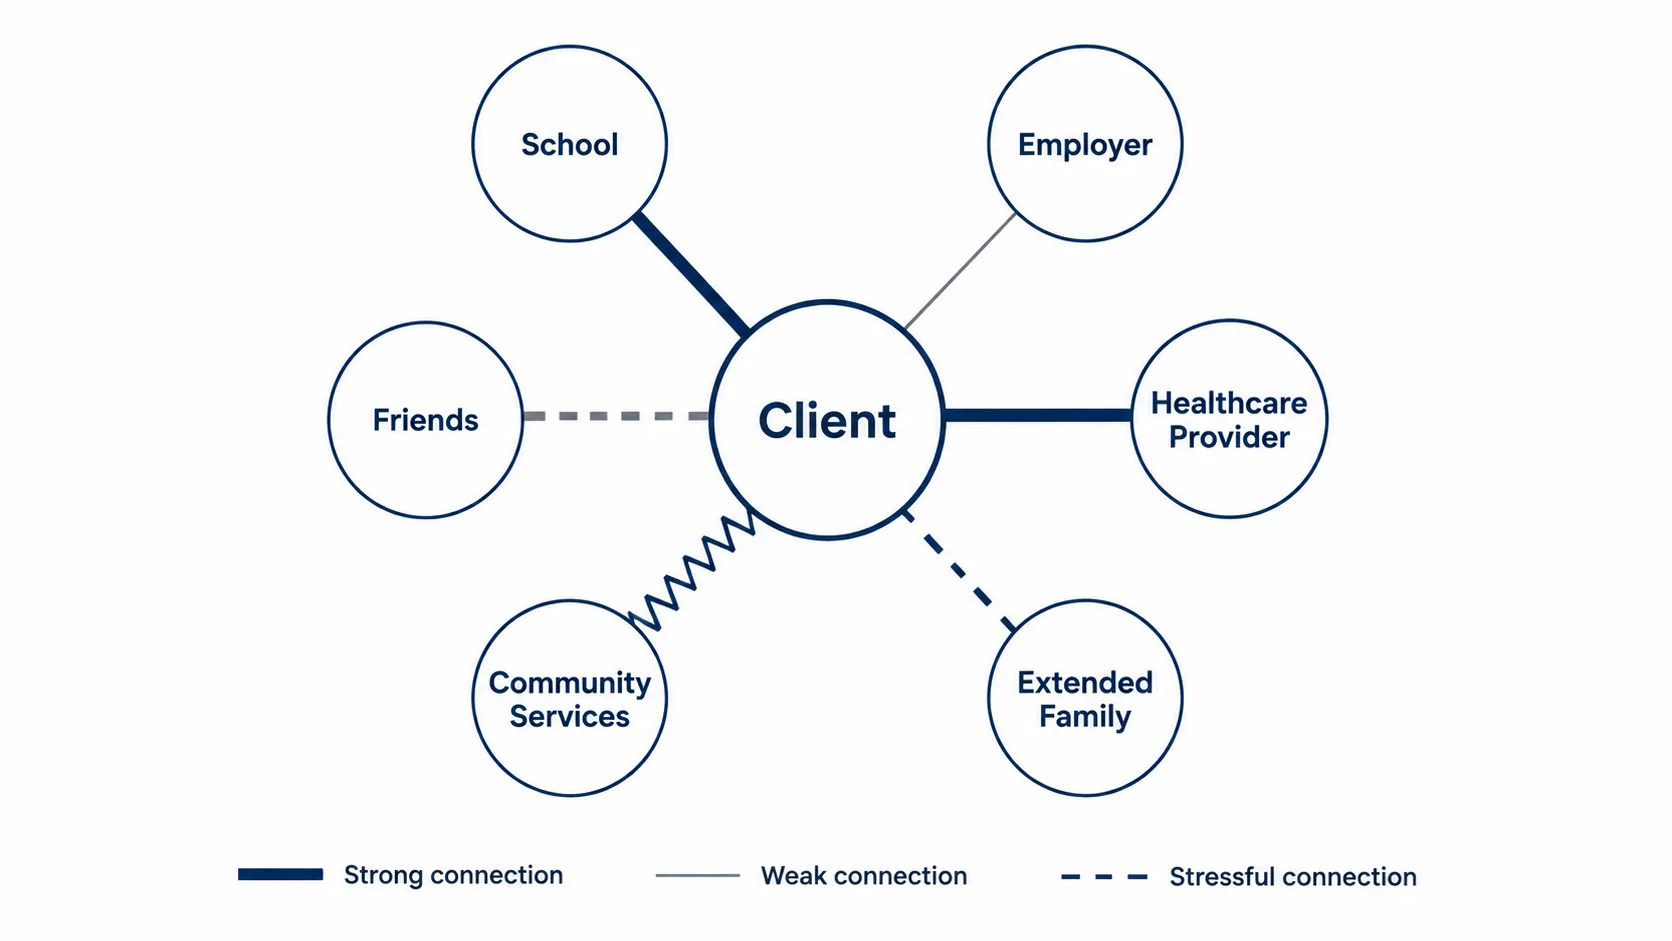
The connections:
- Sarah's mother, Margaret - strong, mutual relationship. Margaret provides regular childcare and emotional support. Double-headed arrow, thick solid line.
- Jake's school - strong connection. School staff have been supportive since Jake's father left. Arrow pointing toward the family.
- Community centre - moderate connection. Jake and Lucy attend an after-school program three days a week. Arrow pointing toward the family.
- Sarah's employer - stressful. Shift work hours conflict with school pickups and create ongoing pressure. Zigzag line, arrow pointing toward the family.
- Housing association - stressful. An unresolved dispute about repairs has been ongoing for six months. Zigzag line.
- GP and healthcare - weak. Sarah has not registered with a local GP since moving two years ago. Dashed line.
What this ecomap shows:
- Margaret is the strongest connection in the diagram. She sits directly beside the center with a double-headed arrow; the family's primary support runs through one person. That is useful information and also a vulnerability: if Margaret's availability changes, the family's support network shifts significantly.
- The two stressful connections, the employer and the housing association, both point toward the center. Sarah is on the receiving end of pressure from two separate external systems simultaneously, alongside managing two children without a co-parent.
- The healthcare gap is visible as a dashed line in a diagram full of solid ones. A family with two school-age children not registered with a GP is a flag that sits clearly in the diagram without anyone needing to draw attention to it.
- Jake's school sits on the strong side. It is one of the few external systems actively supporting the family rather than placing demands on it.
The ecomap does not show why any of these connections are the way they are, but it shows what they are right now, which is what makes it useful for planning where to intervene.
How to Create an Ecomap
1. Decide who the ecomap is about
An ecomap can center on an individual or a family unit. For social work and clinical contexts, it usually centers on the family being assessed. For personal use, it centers on the individual.
2. Draw the center circle
Place a large circle in the middle of your page. Write the names of the family members inside, or a simplified version of the household structure.
3. Identify the external systems to include
Think through every significant connection the person or family has: relationships, institutions, services, community groups. Include the stressful ones as well as the supportive ones; gaps and pressures are part of the picture.
4. Draw outer circles for each system
Place a smaller circle around the center for each external system. Label each one. Position matters loosely; systems with stronger connections can sit closer to the center; stressful or distant ones can sit further away.
5. Draw connecting lines
Connect each outer circle to the center with a line. Choose the line type based on the quality of the relationship: solid for strong, dashed for weak, zigzag for stressful.
6. Add directional arrows
Mark the direction of support on each line. If a system provides support to the family, draw an arrow pointing toward the center. If the relationship is mutual, use a double-headed arrow.
7. Add a key and a date
List every symbol used in a legend. Add the date the ecomap was created; ecomaps change over time as circumstances change, and the date anchors the diagram to a specific point in the assessment.
Types of Ecomaps
- Family ecomap: the most common type. Centers on a family unit and maps all external connections relevant to the household.
- Personal ecomap: centers on an individual rather than a family. Often used in personal development, coaching, or individual therapy. See personal ecomap.
- Social work ecomap: used at intake or during case review to assess a client's support network and identify gaps or stressors.
- Nursing ecomap: used to map a patient's support systems during a health assessment, particularly for chronic illness management or discharge planning. See ecomap nursing.
- Spiritual ecomap: includes faith community and spiritual practices as named external systems, often used in pastoral counseling or holistic health contexts. See spiritual ecomap.
- Clinical ecomap: uses the same diagram in formal assessment or care-planning settings where notation, dating, and record handling matter. See clinical ecomap.
For context-specific walkthroughs, see ecomap for foster care, ecomap for mental health, ecomap for addiction recovery, and ecomap nursing.
Ecomap vs Genogram
An ecomap and a genogram answer different questions.
A genogram maps the family across generations; who is in the family, how they are related, what health conditions and relationship patterns have persisted over time. It is focused on the internal family system and its history.
An ecomap maps the family's current environment; what external systems they are connected to, how strong or stressful those connections are, and where gaps in support exist. It is focused on the present moment.
In social work and clinical practice, the two are often used together. For a direct comparison, see ecomap and genogram.
The genogram provides the historical and relational context; the ecomap provides the current environmental picture. Together, they give a more complete assessment than either does alone.
A full comparison of how the two tools differ and when to use each is covered in the ecomap and genogram article.
FAQ
What is an ecomap used for?
An ecomap is used to assess the quality and strength of a person's or family's connections to the world around them. It shows which external systems are supportive, which are stressful, and where gaps in support exist. In social work and clinical practice, it is used at intake and during case reviews to plan where intervention is needed. It can also be used for personal reflection on support networks.
What are the symbols in an ecomap?
The main symbols are a large center circle for the family, smaller outer circles for each external system, and three types of connecting lines: thick or double solid lines for strong relationships, thin dashed lines for weak connections, and zigzag lines for stressful relationships. Directional arrows on the lines show which way support flows. A key listing each symbol should always appear on the finished diagram.
How do you draw an ecomap?
Start with a large circle in the center representing the family or individual. Add smaller circles around the outside for each significant external system. Connect each outer circle to the center with a line. Add arrows to show the direction of support. Include a key and the date the diagram was created.
What is the difference between an ecomap and a genogram?
A genogram maps the internal family system across generations; who is in the family, how they relate to each other, and what patterns have persisted over time. An ecomap maps the external environment around the family right now; which systems they are connected to and how strong or stressful those connections are. Genograms look backward and inward; ecomaps look at the present and outward.
What are the different types of ecomaps?
The most common types are the family ecomap (centered on a household), the personal ecomap (centered on an individual), the social work ecomap (used for clinical assessment), the nursing ecomap (used in health contexts), and the spiritual ecomap (which includes faith and spiritual connections as named systems). The structure and symbols are the same across all types; what changes is who or what sits in the center and which external systems are relevant.
Sources
- Diagrammatic assessment of family relationships. Social Casework, 59(8), 465–476
- Genograms: Assessment and Intervention (3rd ed.). W.W. Norton & Company.