Appearance
How to Make a Genogram for Social Work
A social work genogram is a family diagram built for assessment, not just family history. It maps at least three generations, but also adds case-relevant details such as household structure, custody, CPS involvement, mental health history, substance use, conflict, and support patterns so a worker can see the whole family situation at once.
Before You Start
If you're new to genograms, read How to Make a Genogram first before continuing here.
This guide uses the EasyGenogram tool to build an example family genogram for social work.
If you’d rather draw by hand, draw in Microsoft Word, Google Docs or make one in Canva instead, read the appropriate guides on how to do so.
How to Make a Genogram for Social Work: Step by Step
These are seven steps on making a genogram for social work.
Step 1: Gather the Information
A social work genogram starts with an interview or a form to gather the needed information about the subject. Collect this:
- Basic structure: who is in the immediate household, who the parents and grandparents are, any previous partners and children from those relationships.
- Social history: custody arrangements, Child Protective Services (CPS) or child protection involvement, placement history, and legal history.
- Health and behavioral patterns: mental health diagnoses, substance use, significant medical conditions across all generations.
- Relationship quality: who the primary person is close to, who they're in conflict with, who has cut contact, etc.
Leave gaps where information is unknown. An incomplete genogram is still useful, and genograms are meant to be updated over time.
For this walkthrough, we’ll use Claire's family, here’s information on them:
- Claire, 34, is the primary person.
- She lives with her two children, Noah (8) and Mia (5), and her current partner, Derek, 28 (unmarried, cohabiting).
- She’s divorced from Pete, 41, the biological father of Noah and Mia.
- Claire's parents, Janet (55) and Ray (70), divorced when she was a teenager.
- Ray remarried Keisha, 60; they have a son, Jonas, 24.
- Janet did not remarry.
- Claire's maternal grandparents, Richard (85) and Alicia (82), are both alive and still married.
- Claire's paternal grandfather, Joseph (88), is deceased; his wife Sarah (88) is still alive.
Step 2: Start with the Primary Person and their Immediate Household
Go to the Genogram Creator.
Drag a shape from the sidebar to add Claire, or edit a shape from the pre-existing ones on the canvas.
Click her shape and toggle Primary Person on; this marks her as the subject the genogram is built around.
Click Claire's shape and select Add Partner to add Derek. Move Derek to Claire's left; in any couple pair, males sit on the left, females on the right. Set the relationship line to Cohabitation.
Click Claire's shape again and select Add Partner to add Pete. Move Pete further out to the left of Derek; the most recent partner stays closest. Set the relationship line to Divorce.
Click Pete or Claire's shape and select Add Children; Noah and Mia drop in below their line. The children connect vertically to Claire and Pete's line automatically.
Draw a household line around Claire, Derek, Noah, and Mia to show they live together.
Genogram Showing Primary Person's Household
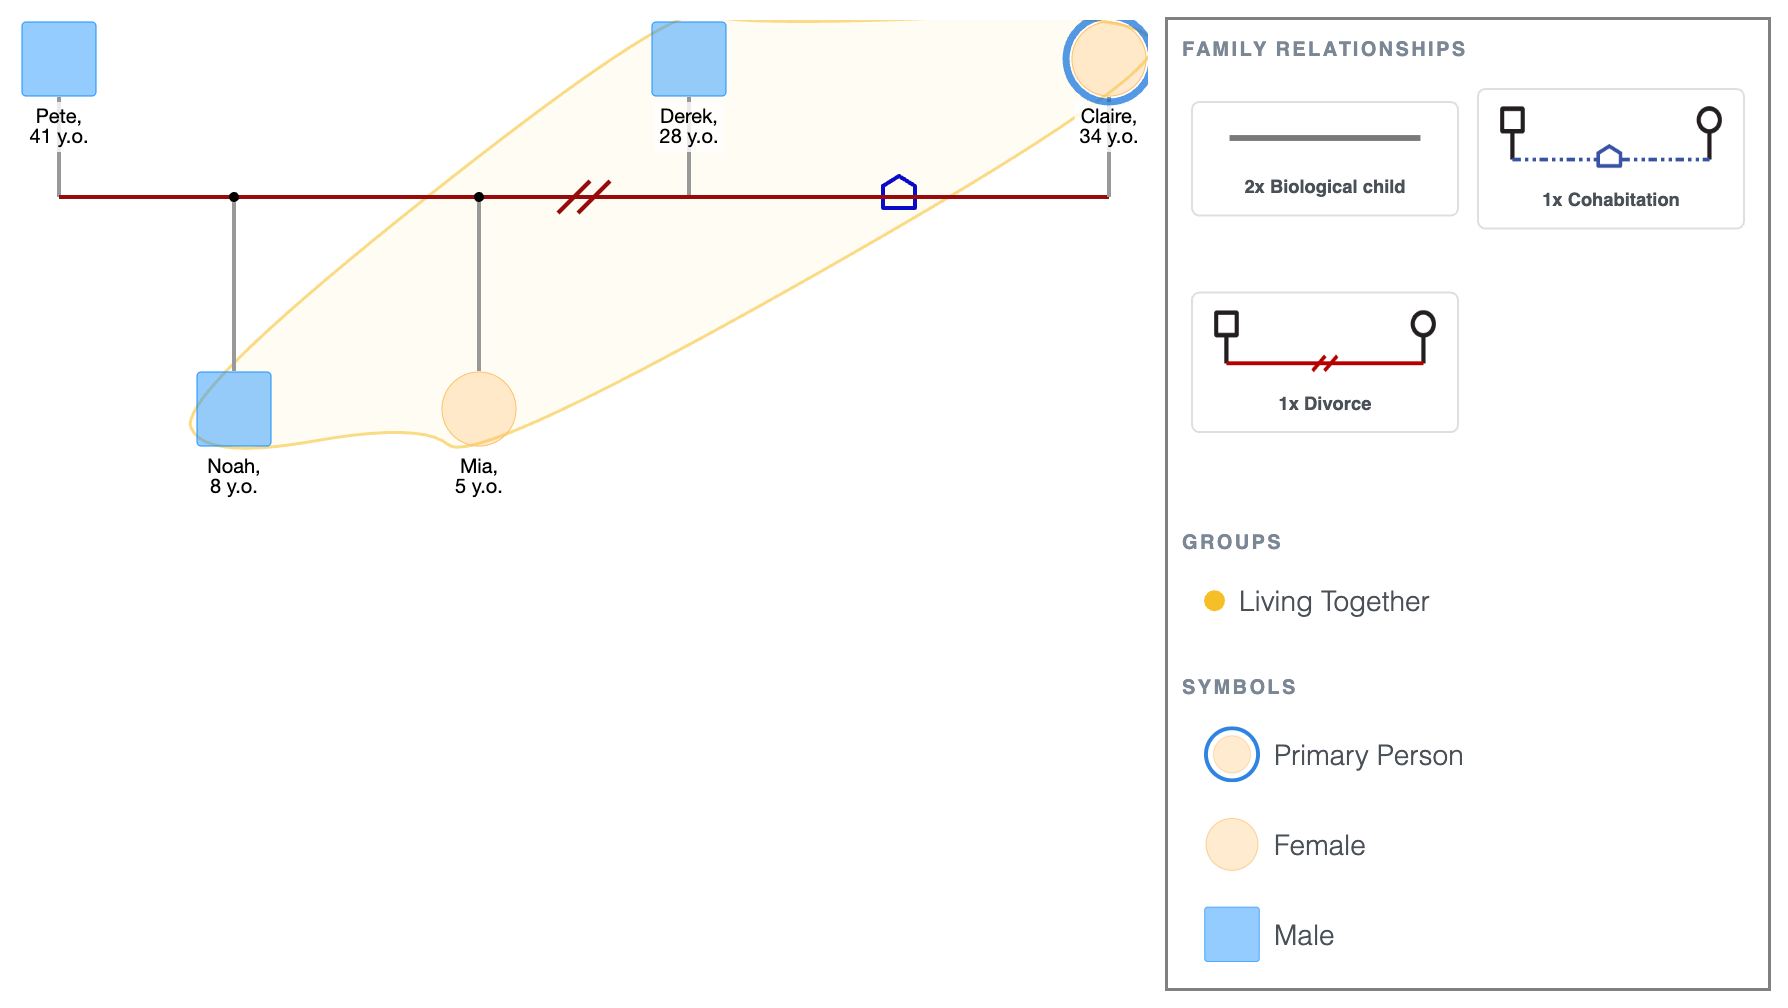
Even at this early stage, the household picture raises questions worth noting.
Claire's children live with a non-biological parent figure, Derek, while their biological father Pete is outside the household.
That separation, and what it means for Noah and Mia's stability, is already visible before a single annotation is added.
Step 3: Add the Parents' Generation
Click Claire's shape and select Add Parents, set it to 1 generation back; Janet and Ray drop in above, already connected to Claire. Alternatively, you can use the Multi-Generations template.
Move Ray to the left and Janet to the right. Set their relationship line to Divorce.
Click Ray's shape and select Add Partner to add Keisha. Set the relationship line to Marriage.
Click Ray or Keisha's shape and select Add Children; Jonas drops in below their line on the same horizontal level as Claire.
Genogram Showing Three Generations
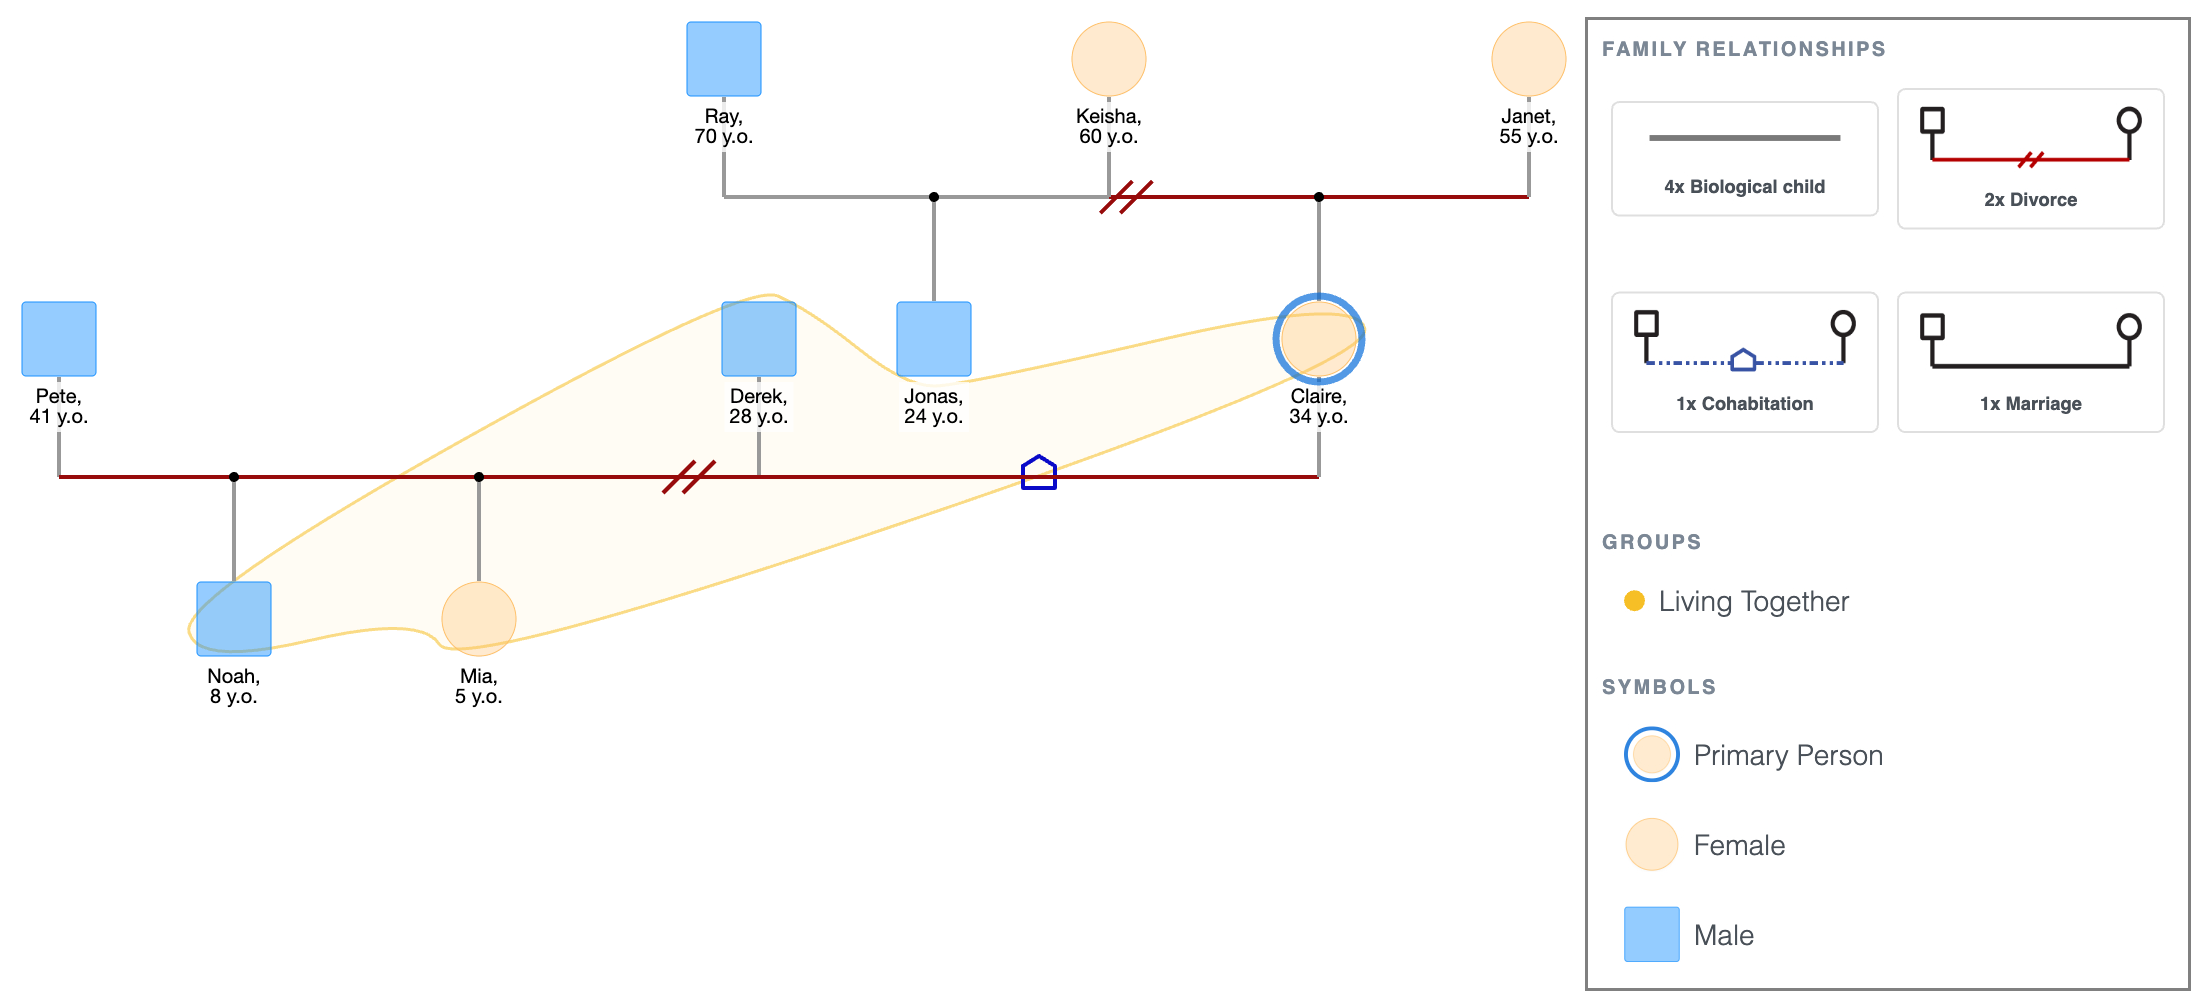
At this level, the genogram shows that Claire grew up with divorced parents.
Her father built a new family, so she has a half-sibling, Jonas, who is 10 years younger. Janet remained alone.
The genogram now shows Claire navigating at least three family units simultaneously: her own household, her mother’s, and her father's second family.
This kind of structural complexity often carries with it emotional weight that the next steps will make visible.
Step 4: Add the Grandparents' Generation
Click Janet's shape and select Add Parents; Richard and Alicia drop in above, already connected to Janet. Set their relationship line to Marriage.
Click Ray's shape and select Add Parents; Joseph and Sarah drop in above, already connected to Ray. Set their relationship line to Marriage.
Joseph is deceased; click his shape and mark him as Passed Away to add the X.
Genogram Showing Four Generations
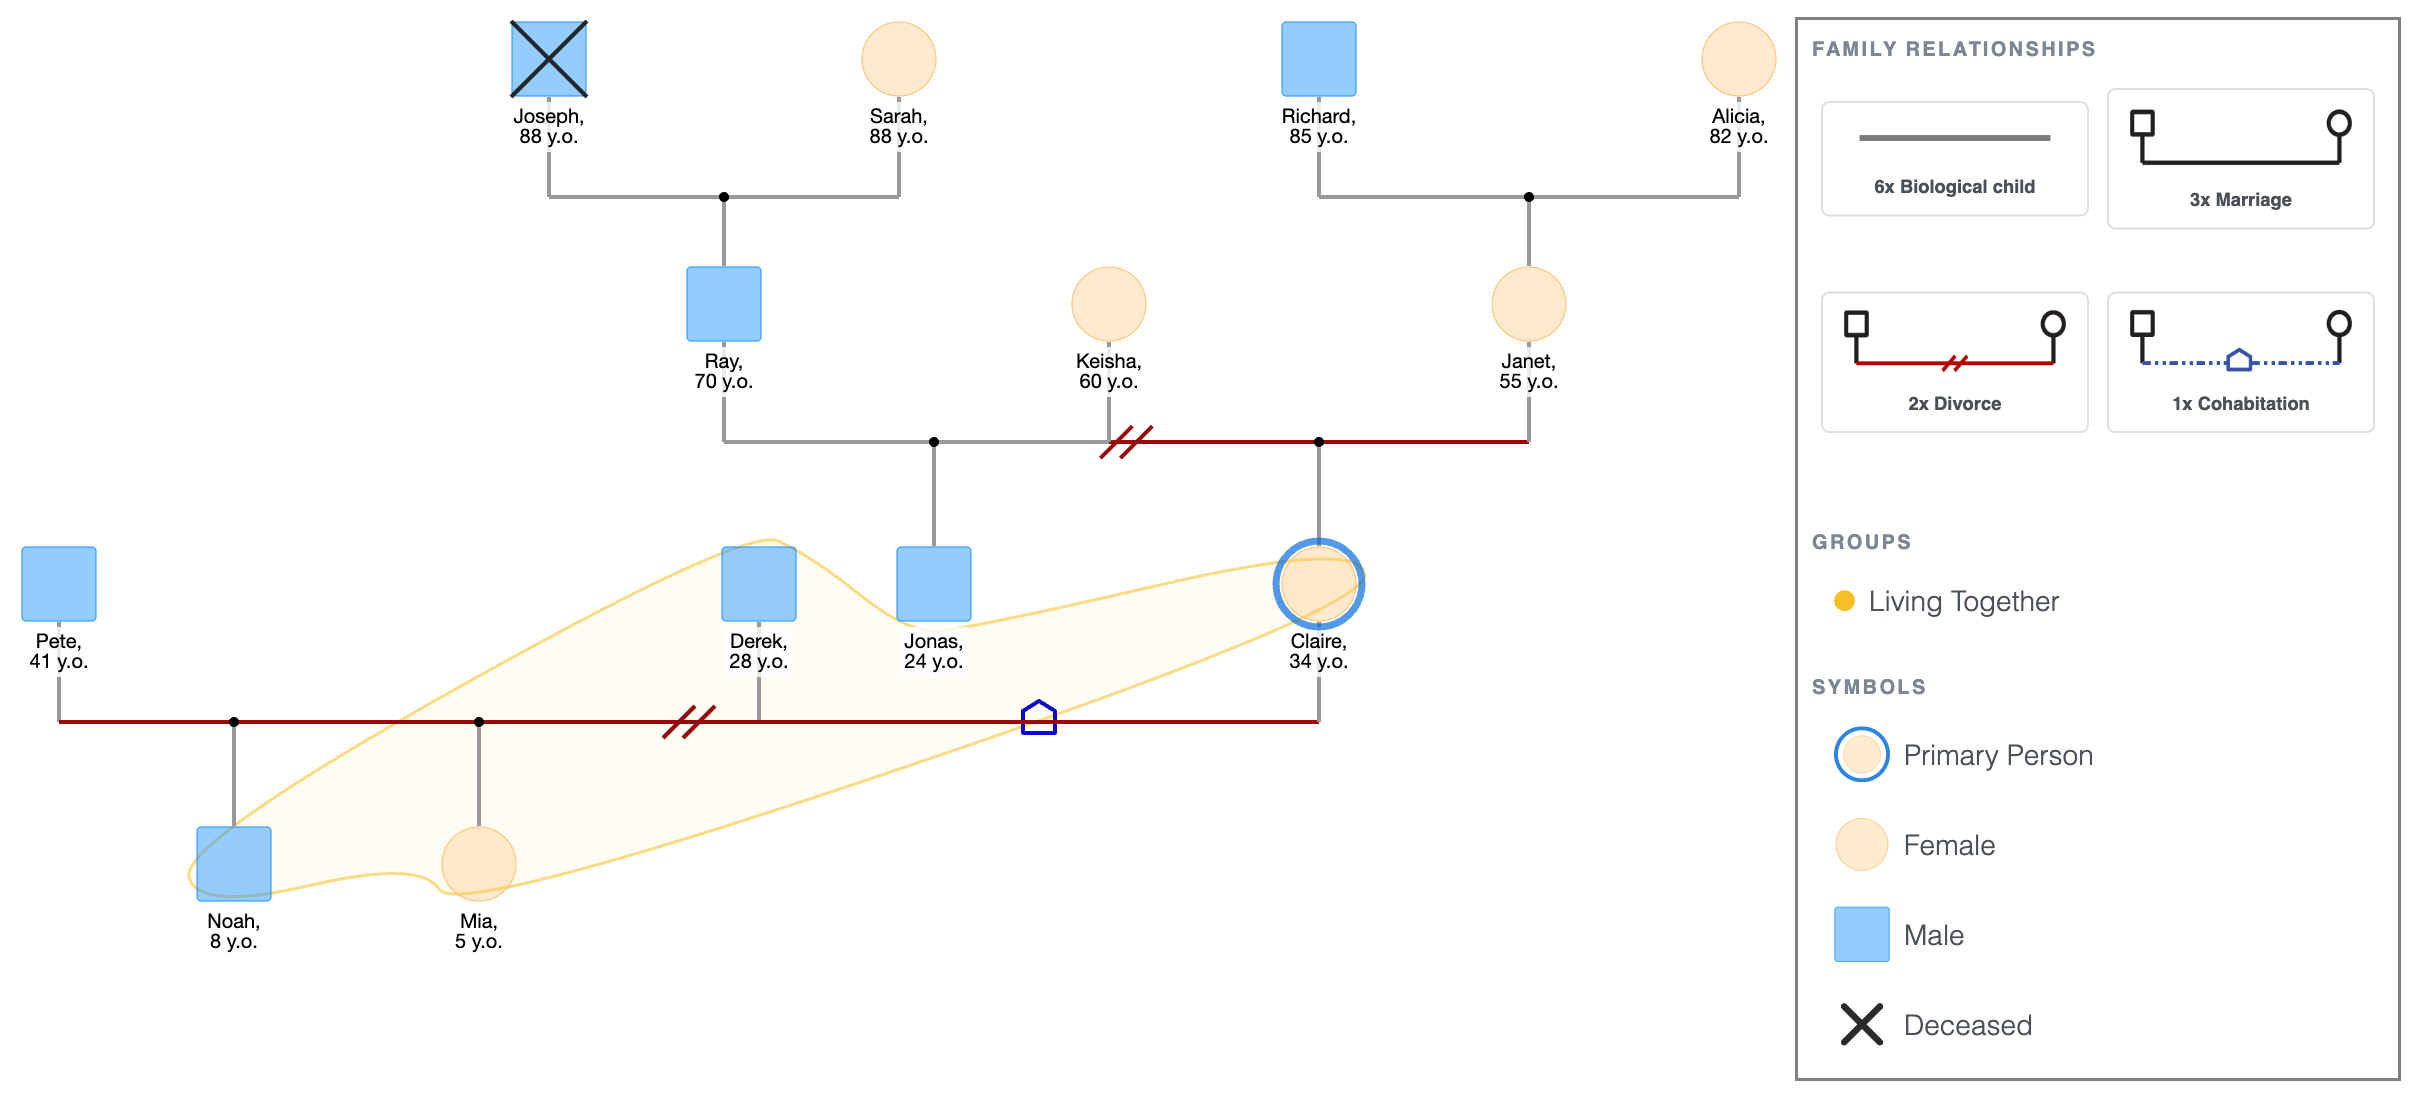
Four generations are now in place.
Both of Claire’s maternal grandparents are alive and still married, which matters for the assessment, as they represent a potentially stable older generation on one side of the family.
This full structure makes patterns visible in the steps ahead.
Step 5: Add Emotional Relationship Lines
Draw emotional lines after the structure is complete so they route cleanly around existing connections.
For Claire's family:
- Claire and Janet: conflict line.
- Claire and Ray: distant/poor line.
- Claire and her maternal grandmother Alicia: very close line.
- Noah and Derek: close line.
To do this:
- Click Claire's shape; the quick-add buttons appear. Click Connect, then click Janet's shape. A relationship picker pops up, select the conflict line.
- Click Claire's shape again, click Connect, then click Ray's shape. Select the distant/poor line.
- Click Claire's shape, click Connect, then click Alicia's shape. Select the very close line.
- Click Noah's shape, click Connect, then click Derek's shape. Select the close line.
Genogram Showing Four Generations with Emotional Relationships
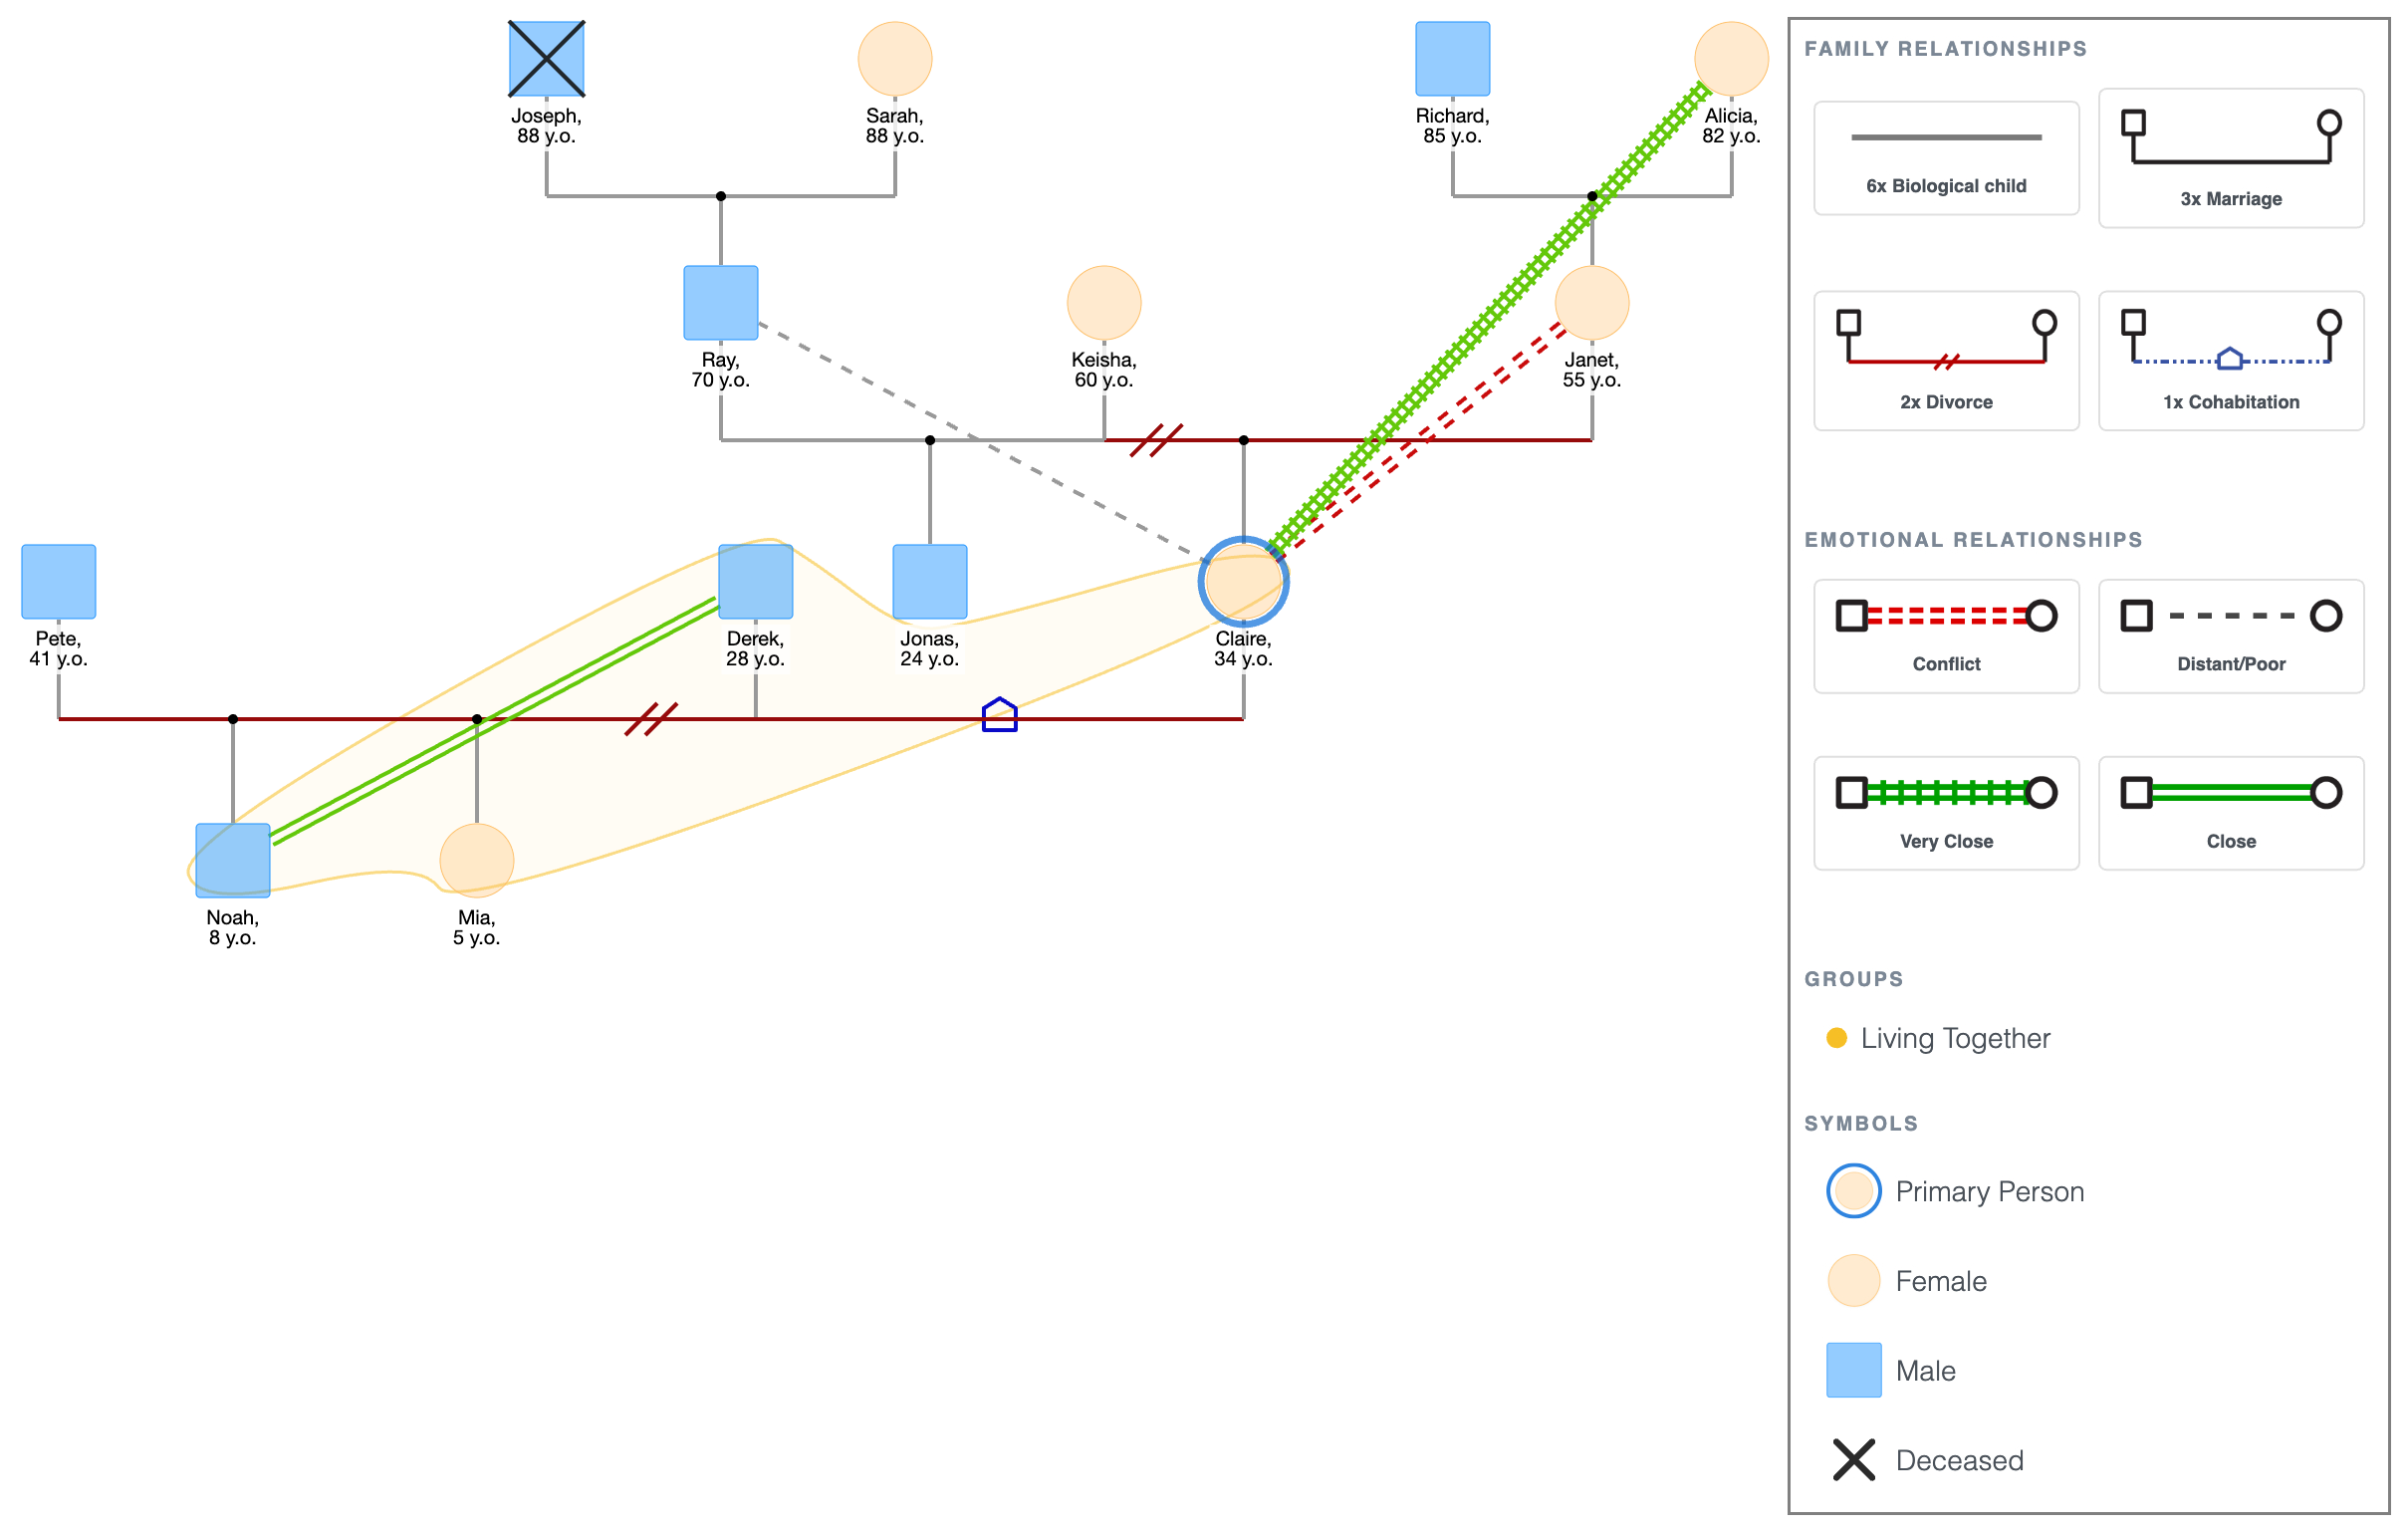
The emotional layer changes what you see.
Claire is in conflict with her mother and emotionally distant from her father; both primary attachment figures from childhood are either adversarial or absent.
Her closest bond is with her maternal grandmother, Alicia, two generations up.
Noah, meanwhile, has formed a close bond with Derek, a non-biological parent. That bond may be a protective factor worth noting in the assessment.
Step 6: Add Health Conditions and Relevant Annotations
Tap any shape to open the details panel.
Use the Add Health Condition field for diagnoses and the Notes field for everything else.
For Claire's family:
- Janet: anxiety (health condition).
- Ray: alcohol misuse (health condition).
- Claire: depression (health condition); note: open CPS case, 2024.
- Noah: behavioral concerns flagged at school (note).
- Claire's maternal grandmother: type 2 diabetes (health condition).
4-Generation Genogram with Emotional Relationships, Health Conditions and Relevant Annotations
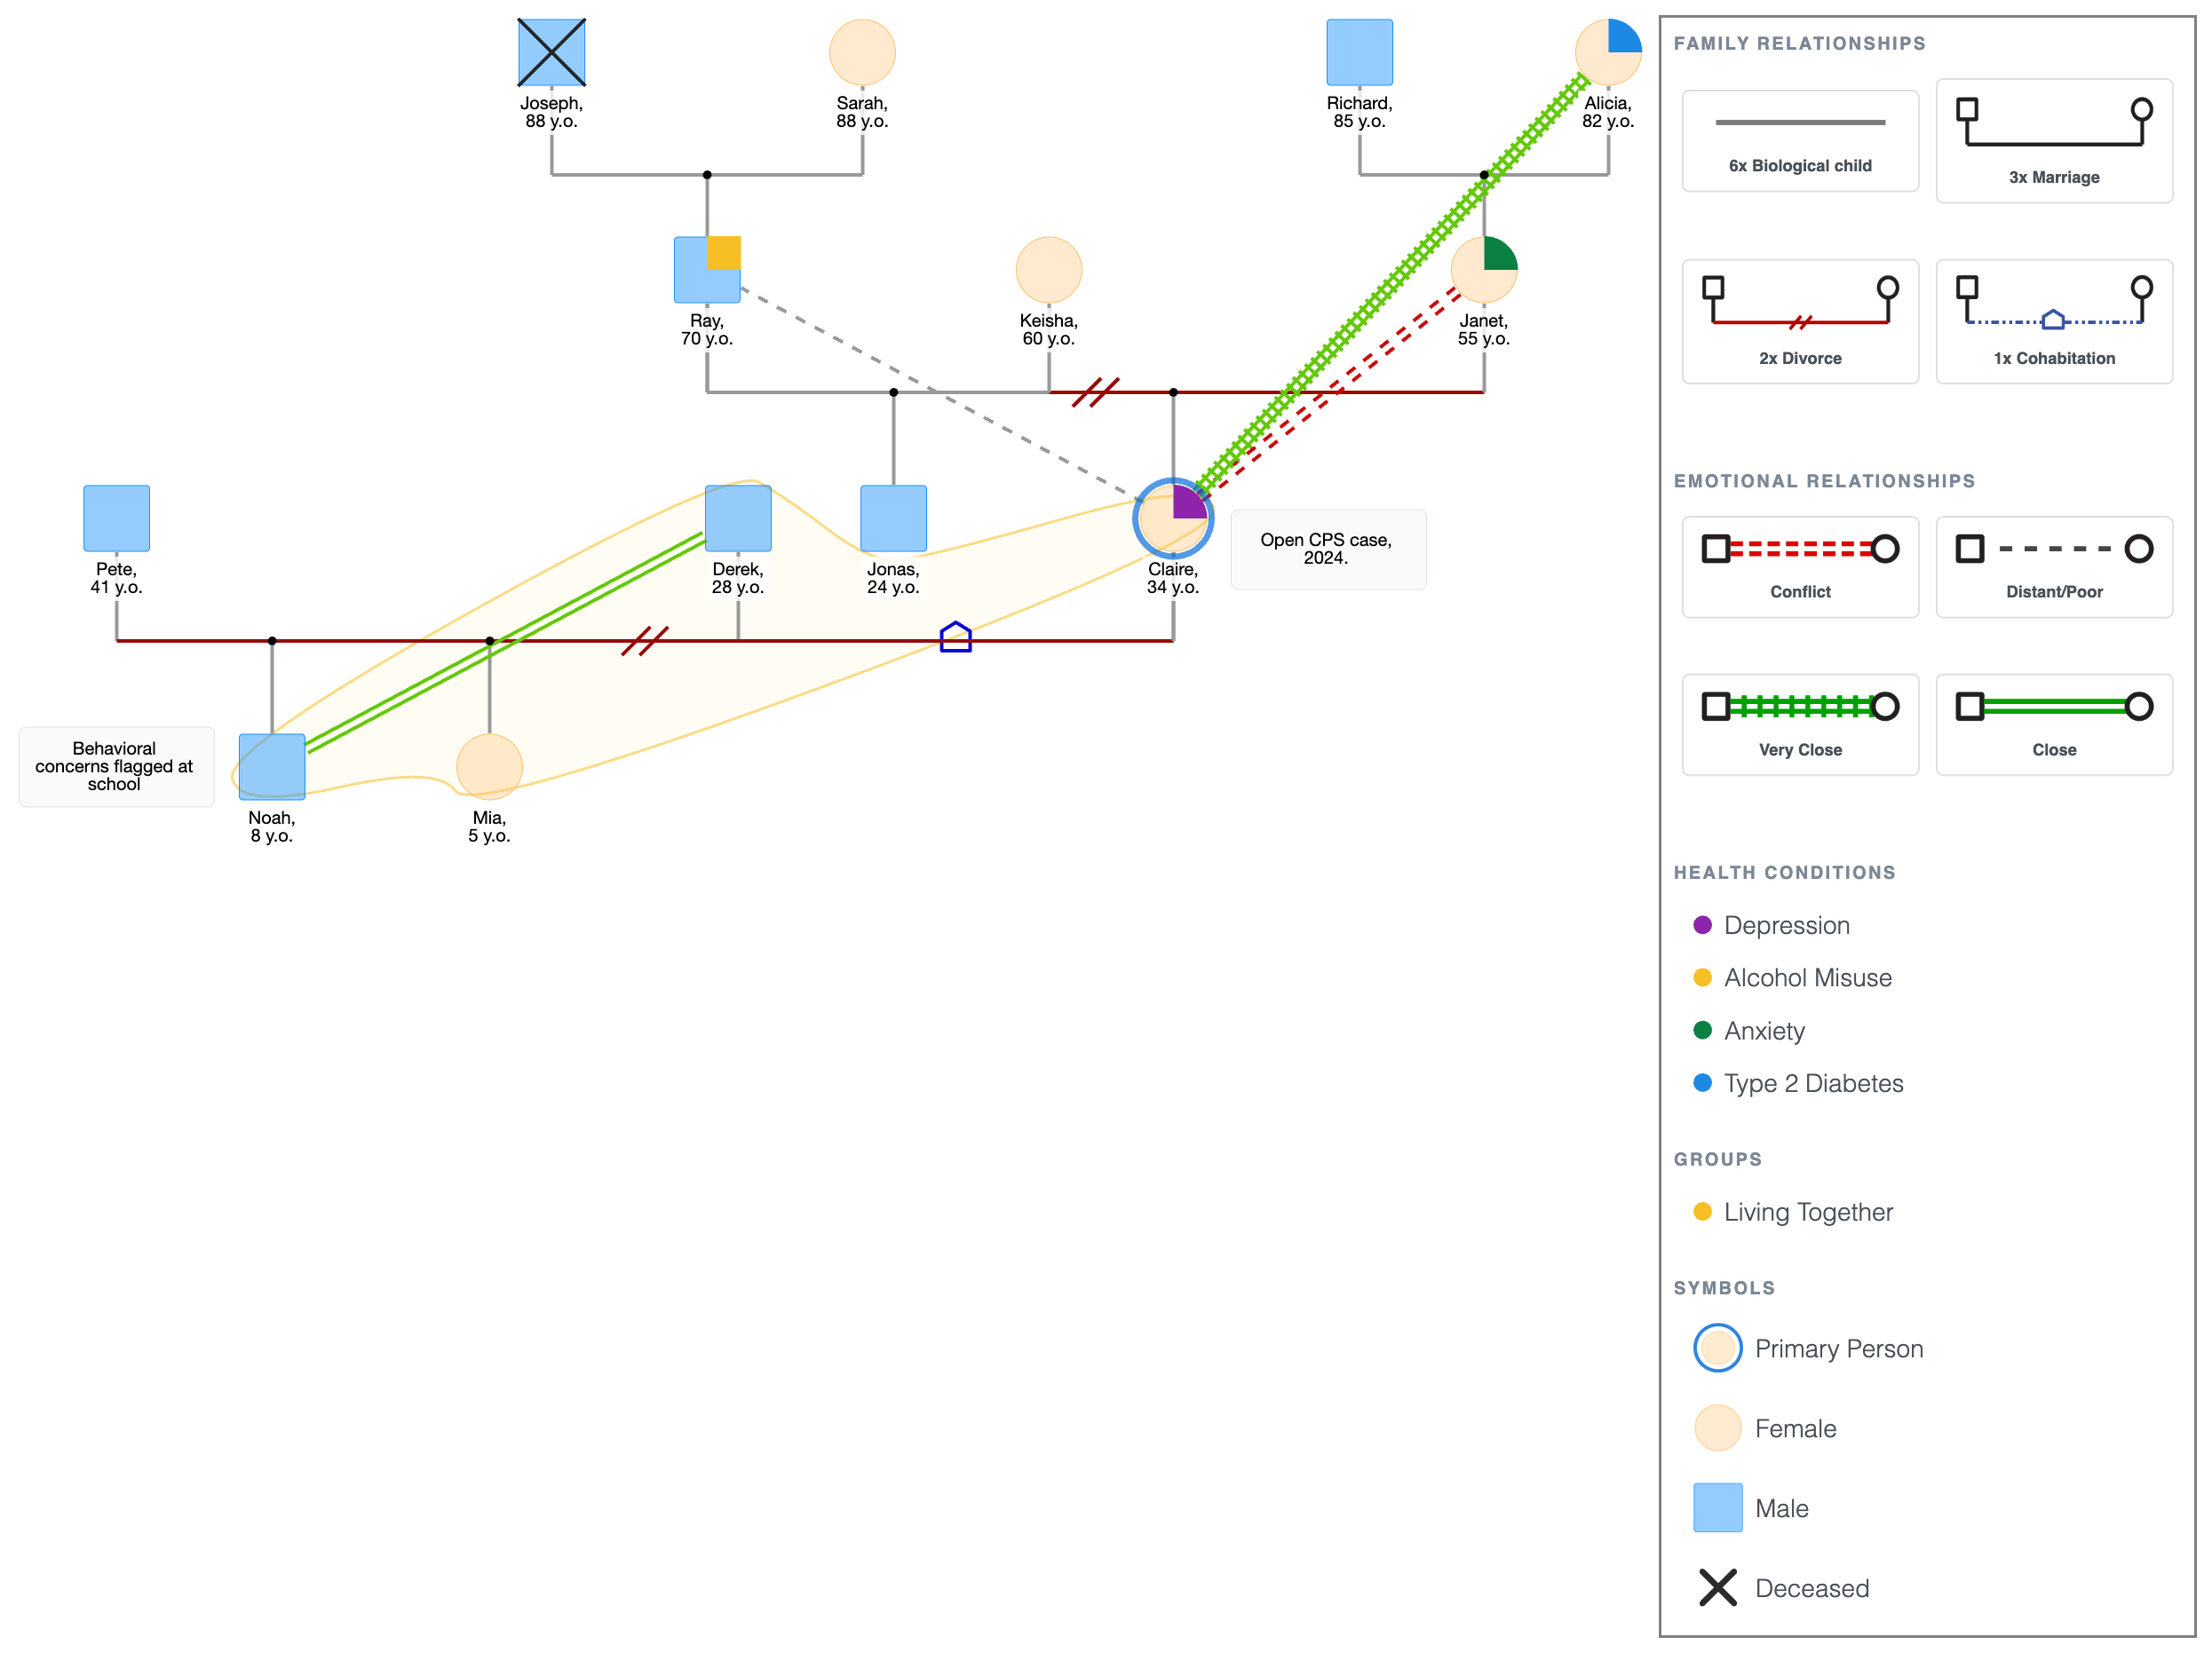
This is where the intergenerational pattern becomes hard to ignore.
Ray's alcohol misuse and Janet's anxiety sit in the generation above Claire.
Claire herself is managing depression and an open CPS case.
Noah, one generation down, is already showing behavioral signs at school.
What looked like Claire's individual situation now reads as a pattern that has been building across at least two generations, and is showing early signs of continuing into a third.
Step 7: Review and Export
Before exporting, run through this checklist to avoid the common mistakes in making a genogram:
- Household composition is accurate and household lines are drawn.
- All relationship lines reflect the correct type.
- Emotional lines are drawn for the relationships that matter to the assessment.
- Health conditions and relevant history are annotated on the right people.
- The primary person is marked.
- All relevant generations are present.
- A legend is visible.
On what to include:
- A child welfare assessment needs custody, placement, and child protection history in full.
- A mental health assessment focuses on diagnoses, substance use, and emotional relationships.
- An elderly care assessment centers on caregiver availability and medical history.
Add only the details that are relevant to the assessment question. Cut what isn't; it clutters the diagram without adding value.
To export: tap PDF or PNG in the top bar.
4-Generation Genogram with Emotional Relationships, Health Conditions and Relevant Annotations
Explore this genogram and adapt it to your needs.
FAQ
What is a genogram in social work?
A genogram in social work is a visual map of a family across at least three generations used for assessment and intervention planning. It combines family structure with case-relevant details such as relationship quality, custody, household membership, mental health history, substance use, conflict, and support patterns.
How is a social work genogram different from a regular genogram?
The structure is the same: at least three generations, standard symbols, and relationship lines. What's different is what you include. A social work genogram adds household lines, child protection history, placement history, legal history, and behavioral annotations alongside the standard medical and emotional data. It's built around the primary person; the subject of the assessment.
How many generations should a social work genogram include?
Three is the standard. A fourth is worth adding when there are clear intergenerational patterns such as addiction, abuse, or mental health history that visibly started earlier. Beyond four, the diagram usually becomes too crowded to read clearly. Only add that much where necessary.
Can I use online genogram tools to make a social work genogram?
Yes. An online genogram tool can speed up social work documentation because it keeps symbols, household lines, relationship lines, and health markers consistent. EasyGenogram lets you build the diagram in the browser and export it for case files, reports, or supervision.
Does a social work genogram need to be kept confidential?
Yes. A social work genogram contains sensitive information like diagnoses, legal history and family conflict. It is subject to the same confidentiality obligations as any clinical record. If you're using a digital tool, confirm it stores data securely before entering information. Don't share, print, or export a genogram without following standard data protection policy.
Sources
- Genograms: Assessment and Treatment (4th ed.)
- NASW Code of Ethics
- Focused Genograms: Intergenerational Assessment of Individuals, Couples, and Families (2nd ed.)