Appearance
Genogram Interpretation
Genogram interpretation is the process of reading family structure, relationship lines, roles, and repeated patterns as one system. It helps therapists, social workers, students, and healthcare professionals move beyond identifying symbols and toward explaining what the diagram suggests, what remains uncertain, and what needs follow-up.
The Four Levels of Genogram Interpretation
Clinical genogram training moves through four levels, concrete to abstract.
Working through them in order keeps interpretation systematic instead of jumping straight to a conclusion.
1. Structural
The basic composition of the family:
- How many generations are on the diagram.
- Who's married, divorced, or widowed.
- Who's died, and at what age.
- Where people live relative to each other.
- What information is simply missing.
Structural gaps are worth noting on their own.
A branch with no birth years, or a generation skipped entirely, is often as informative as what's present.
2. Relational
This is where the emotional relationship lines come in:
- Close
- Distant
- Conflict
- Cutoff,
- and the more specific dynamics covered on Genogram Relationship Symbols.
At this level, don't read one line at a time, look for where several lines cluster.
A family where every line converges on one person often means that person is carrying more of the family's emotional weight than their position on the chart suggests.
3. Functional
How the family operates as a system:
- Who takes on the caretaker role.
- Who mediates conflict.
- Who tends to get left out of decisions.
- Who carries the family's anxiety when things go wrong.
These roles are rarely written down anywhere. They show up as a pattern of who connects to whom, and how.
4. Multigenerational
Look across the whole diagram for repetition:
- The same relationship breaking down at the same life stage.
- The same role reappearing in every generation.
- Health conditions or major events clustering in a particular family position.
Bowen called this repetition the multigenerational transmission process, patterns that move through a family whether or not anyone intends them to.
Interpreting Genograms Across Professional Contexts
The four levels above apply broadly, but what you're looking for shifts by setting:
- Social work: support networks and risk. See Genogram for Social Work Assessment.
- Family medicine: the multigenerational level, tracking hereditary conditions. See Genogram in Family Medicine.
- Addiction treatment / grief counseling: functional-level roles, who's absorbing the family's stress. See Genogram in Addiction Treatment / Genogram in Grief Counseling.
- Academic settings: interpretation is often the assignment itself. See Assignment Guide.
Reading Relationship Lines as Patterns
A single conflict line tells you two people don't get along, but a genogram full of conflict lines, all converging on the same in-law, or repeating in the same sibling position across three generations, tells you something structural about the family.
That's the actual value a genogram has over a written history.
For instance, "some tension with my mother" reads as one fact in a paragraph. The same tension, drawn as a conflict line that turns out to match a nearly identical line one generation up, reads as a pattern.
For how conflict specifically spreads across a diagram, see Genogram with Conflict Example.
Triangles: The Building Block of Family Systems
Bowen described the triangle as the basic unit of an emotional system, three people rather than two.
When tension builds between two people, it's common for a third person to get pulled in, such as a child, an in-law, a sibling, who absorbs, redirects, or stabilizes the pressure.
On a genogram, a triangle has a specific shape: closeness in one relationship line, paired with distance or conflict in another, both connected to the same third person.
An enmeshed parent-child bond sitting next to a distant parent-spouse line is a classic example.
Spotting a triangle is relational-level work.
Noticing whether the same triangle shape repeats across generations is multigenerational-level work.
Worked Example: The Whitmore Family
Genogram Interpretation Example for The Whitmore Family
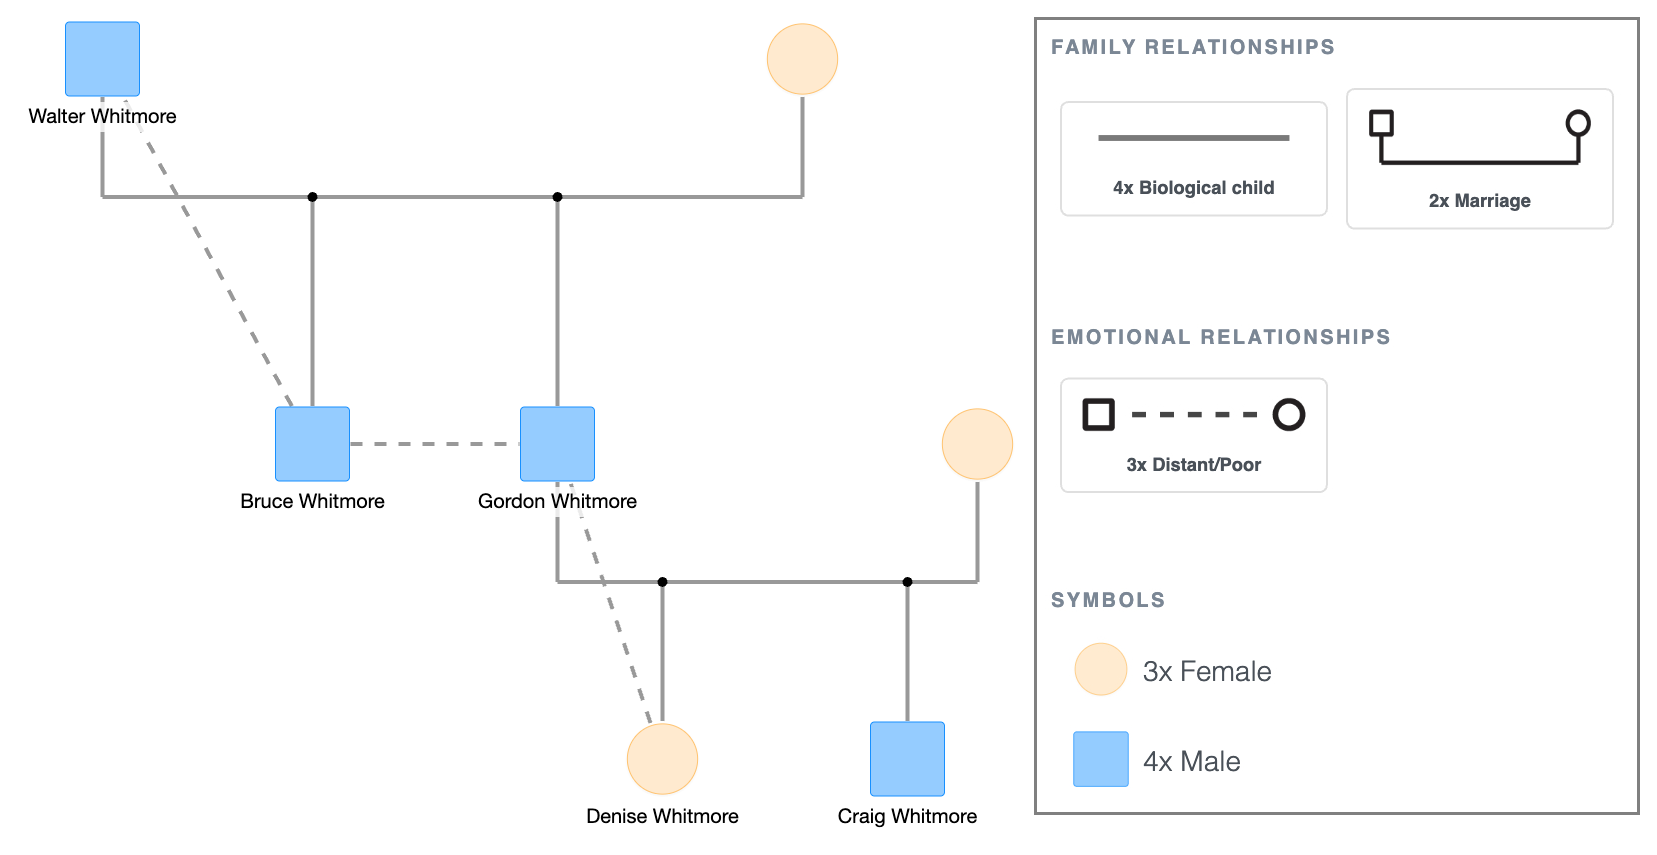
The family:
- Walter Whitmore founded the family business and had two children: Bruce Whitmore (eldest) and Gordon Whitmore.
- When Walter retired, he handed leadership to Gordon, not Bruce.
- Bruce's contact with the family dropped off after that. Distant line to Walter and Gordon.
- Gordon later had two children of his own: Denise Whitmore (eldest) and Craig Whitmore.
- When Gordon stepped back, he handed leadership to Craig, not Denise.
- Denise's contact with the family has thinned the same way Bruce's did. Distant line to Gordon.
What you can now see:
- The same structural decision, eldest child passed over for leadership, shows up twice, one generation apart, on opposite branches of the diagram.
- Both times it produced the same relational consequence: not conflict, just a distant line where the passed-over child used to be closer.
- Bruce's distant line sits in the second generation; Denise's sits in the third, directly beneath Gordon, the person who made both calls.
- Seen separately, these are two ordinary succession decisions. Seen on one diagram, it's a family script repeating itself.
Common Patterns Worth Recognizing in a Genogram Interpretation
- Repeating relationship structures: the same dynamic (an eldest child passed over, a cutoff between fathers and sons) recurring in each generation.
- Anniversary reactions: deaths, marriages, or crises clustering around a similar age or date across generations.
- Concentrated symptoms: a health condition, addiction, or mental health pattern showing up in the same family position generation after generation.
- Loss and replacement: a birth or new relationship following closely after a significant loss.
- Cutoff chains: the same estrangement pattern repeating between different pairs across generations.
None of these are conclusions on their own, but they are reasons to look closer.
Genogram Interpretation vs. Related Tools
Interpretation methodology changes depending on which diagram you're reading:
- Genogram vs Family Tree: how the underlying data and goals differ.
- Genogram vs Pedigree Chart: same, for medical/genetic charts.
- Genogram vs Family Tree vs Ecomap: full three-way comparison.
Genogram Interpretation Is a Hypothesis, Not a Verdict
A genogram is built from what people remember and choose to share. That means it can be incomplete, or shaped by whoever's telling the story.
Clinical literature is consistent on this: read the diagram as a starting point for questions, not a diagnosis.
A pattern that looks obvious on the page might have an explanation the family hasn't mentioned yet. Treat what you see as something to ask about, not something to announce.
A Systematic Genogram Interpretation Checklist
Work through these in order so interpretation doesn't skip straight to a conclusion.
Structure
- How many generations are represented, and where are the gaps?
- Who's died, and at what age? Who's divorced or remarried?
- Where does everyone live relative to each other?
Relationships
- Where do close, distant, conflict, and cutoff lines cluster?
- Is there a person nearly every line connects to?
- Can you spot a triangle, closeness in one line paired with distance or conflict in another, all touching the same third person?
Patterns
- Does the same relationship type appear in the same family position across generations?
- Do similar events (divorce, estrangement, a diagnosis) show up at a similar age more than once?
- Does a family role, caretaker, mediator, the one who gets left out, repeat down the generations?
Practical
- What does the current concern look like against the rest of the diagram?
- What's missing that would be useful to know?
- Is this a genuine pattern, or two unrelated events that happen to look similar?
Getting Started
There's nothing to interpret until the structure, relationships, and roles are actually on the page.
If you haven't built your genogram yet, start with How to Make a Genogram or a template.
Genogram Interpretation Example for The Whitmore Family
Explore this genogram and adapt it to your needs.
FAQ
What does it mean to interpret a genogram?
It means reading past the individual symbols to identify patterns, structural gaps, relationship clusters, family roles, and repetition across generations, rather than treating the diagram as a static family record.
What are the four levels of genogram interpretation?
Structural (composition, generations, gaps), relational (relationship quality and clustering), functional (family roles and how the system manages stress), and multigenerational (patterns repeating across generations).
What is a triangle in genogram interpretation?
A three-person pattern where tension between two people gets managed by pulling in a third. On a genogram, it typically shows up as closeness in one relationship line paired with distance or conflict in another, both connecting to the same person.
Can a genogram interpretation be wrong?
Interpretation is a working hypothesis, not a diagnosis. A genogram is built from what's remembered and shared, so a pattern that looks clear on the page can have an explanation that hasn't come up yet. Treat interpretations as questions to explore, not conclusions to state.
Do I need clinical training to interpret a genogram?
No. Clinical training helps with nuance and the deeper theory behind triangles and multigenerational transmission, but working through structure, relationships, and repetition is something anyone building a genogram can learn to do.
How is interpretation different from just reading the symbols?
Reading symbols identifies what an individual line or shape means. Interpretation connects those individual meanings into a bigger picture, clusters, roles, and repetition across the whole family, not just one relationship at a time.
Sources
- Genograms: Assessment and Intervention (3rd ed.). W.W. Norton & Company
- Reading Genograms: A Clinical Guide. W.W. Norton & Company
- Family Therapy in Clinical Practice
- Family Evaluation. W.W. Norton & Company