Appearance
How to Make a Medical Genogram
A medical genogram maps conditions, causes of death, and age of onset across multiple generations so hereditary health patterns are visible in one diagram. The drawing process is the same as any genogram, but the content is medical: diagnoses, family history, timing, and what those patterns suggest once you step back and read the whole picture.
How to Make a Medical Genogram: Step by Step
These are six steps to make a medical genogram.
Step 1: Gather the medical information
Collect this before drawing anything. The structure goes quickly. The information is what takes time.
Always needed:
- Names, genders, and relationships.
- Diagnosed conditions for each person.
- Cause of death and approximate age for deceased members.
- Age of onset for major conditions where known.
Extras:
- Mental health diagnoses.
- Substance use history.
- Genetic or hereditary conditions.
For this walkthrough, we’ll use the Prentiss-Wood family. Here’s information on them:

Two threads are already visible before drawing anything: a cardiovascular thread running through the paternal line, and a mental health thread appearing in the second and third generations. The diagram will make these more visible at once.
Step 2: Build the family structure
- Click the + button on the canvas to add a person, or drag a shape from the sidebar.
- Place George (square) on the left. Click his shape; the quick-add buttons appear. Click Add Partner to add Helen; EasyGenogram draws the marriage line between them automatically.
- George is deceased; click his shape and mark him as Passed Away to add the X.
- Click George or Helen's shape and select Add Children. Mark and Anne drop in below, already connected to the generation above.
- Move Mark to the left and Anne to the right. Click Mark's shape and mark him as the primary person.
- Click Mark's shape and select Add Partner to add Carol. EasyGenogram draws the marriage line automatically.
- Click Anne's shape and select Add Partner to add David. Drag David to Anne's left so the couple pair reads as male left, female right.
- Click Mark or Carol's shape and select Add Children; Tyler and Sophie drop in below their marriage line. Move Tyler to the left and Sophie to the right.
- Click Anne or David's shape and select Add Children; Liam drops in below their marriage line.
Prentiss-Wood 3-Generation Family Genogram
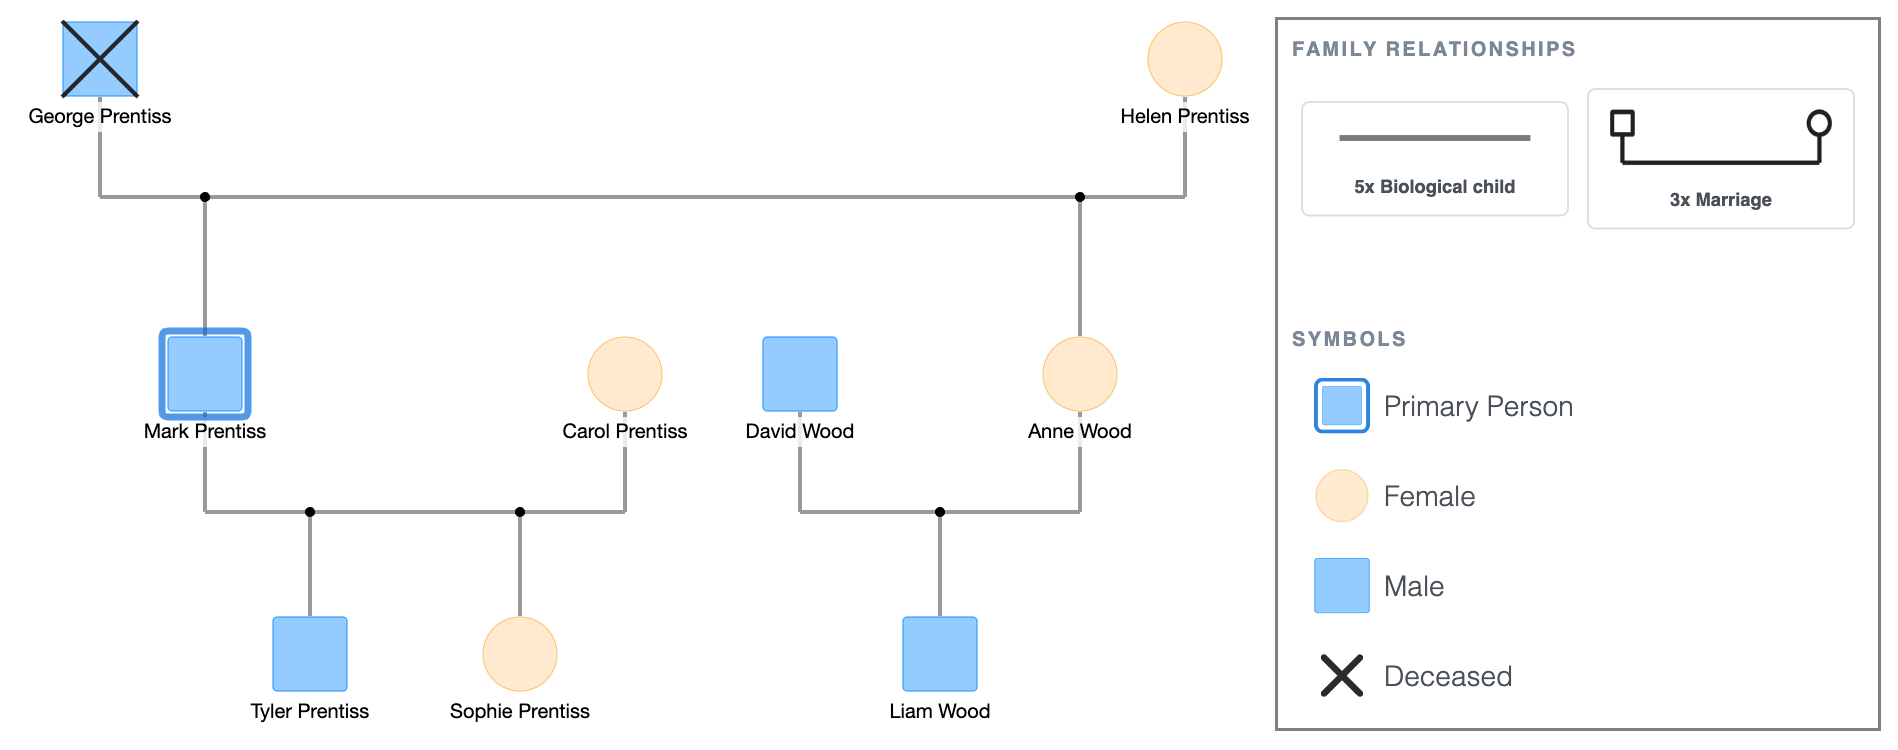
At this point, it looks like any other basic genogram. The next steps are what make it medical.
Step 3: Add health conditions
Attach each condition directly to the person it belongs to, as a label on or near their symbol.
Using the Prentiss-Wood family:
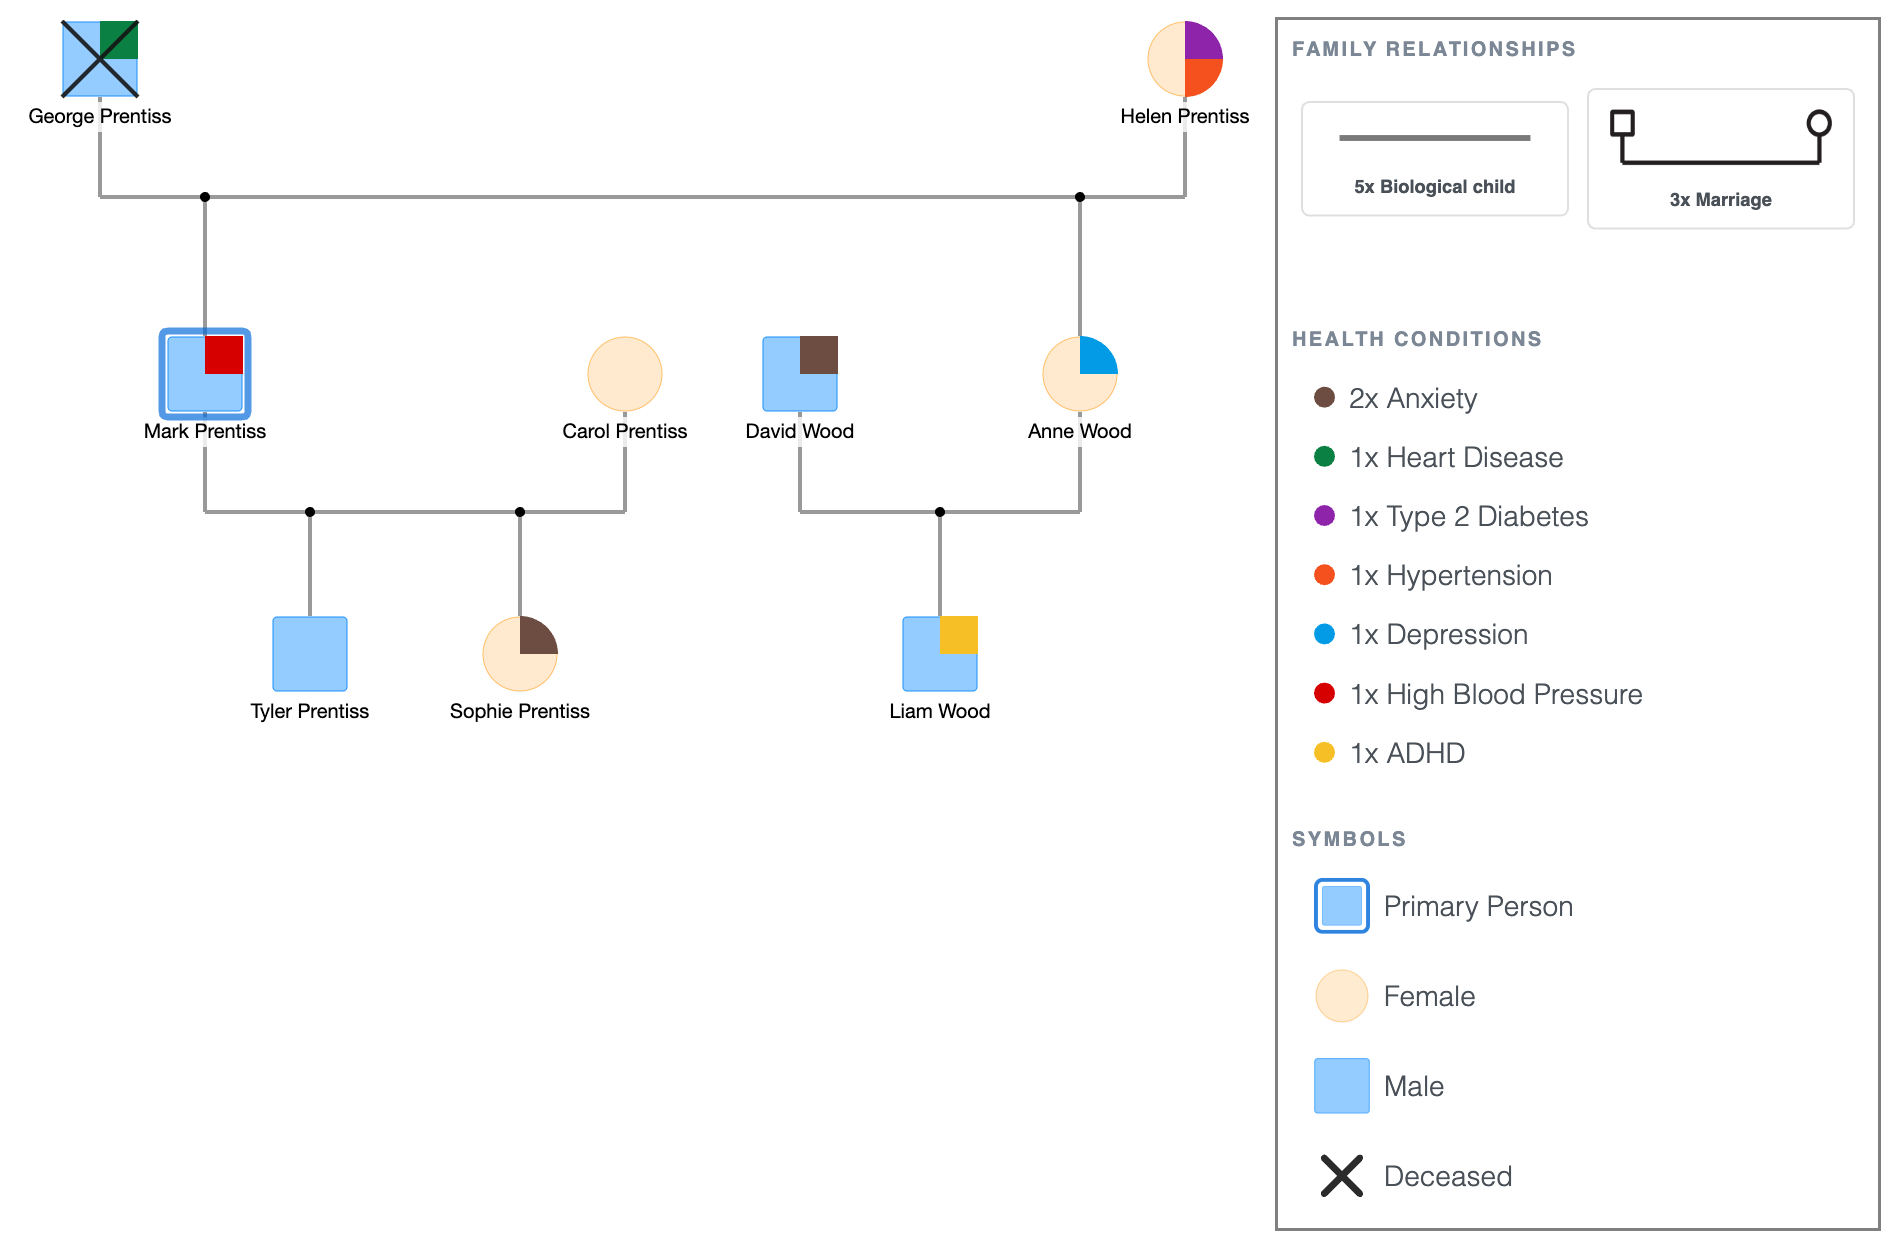
- George: heart disease.
- Helen: type 2 diabetes, hypertension.
- Mark: high blood pressure.
- Anne: depression.
- David: anxiety.
- Sophie: anxiety.
- Liam: ADHD.
Write conditions as precisely as you have them. "Diabetes" tells you little. "Type 2 diabetes" tells a physician something different from "type 1." The specificity is what makes the diagram useful.
Prentiss-Wood Family Genogram Showing Medical Conditions
Step 4: Add the age of onset and the cause of death
For deceased members, the cause of death and age should be part of their symbol.
For living members with chronic conditions, the age of onset helps distinguish early-onset (more likely genetic) from late-onset (more likely lifestyle-related).
Using the Prentiss-Wood family:
- George: heart attack, died at 70.
- Helen: type 2 diabetes, mid-60s onset.
- Mark: high blood pressure, diagnosed at 45.
- Anne: depression, diagnosed in her mid-30s.
- David: anxiety, mid-30s onset.
- Sophie: anxiety, onset at 17.
- Liam: ADHD, diagnosed at 12.
Prentiss-Wood Family Genogram Showing Medical Conditions and Ages
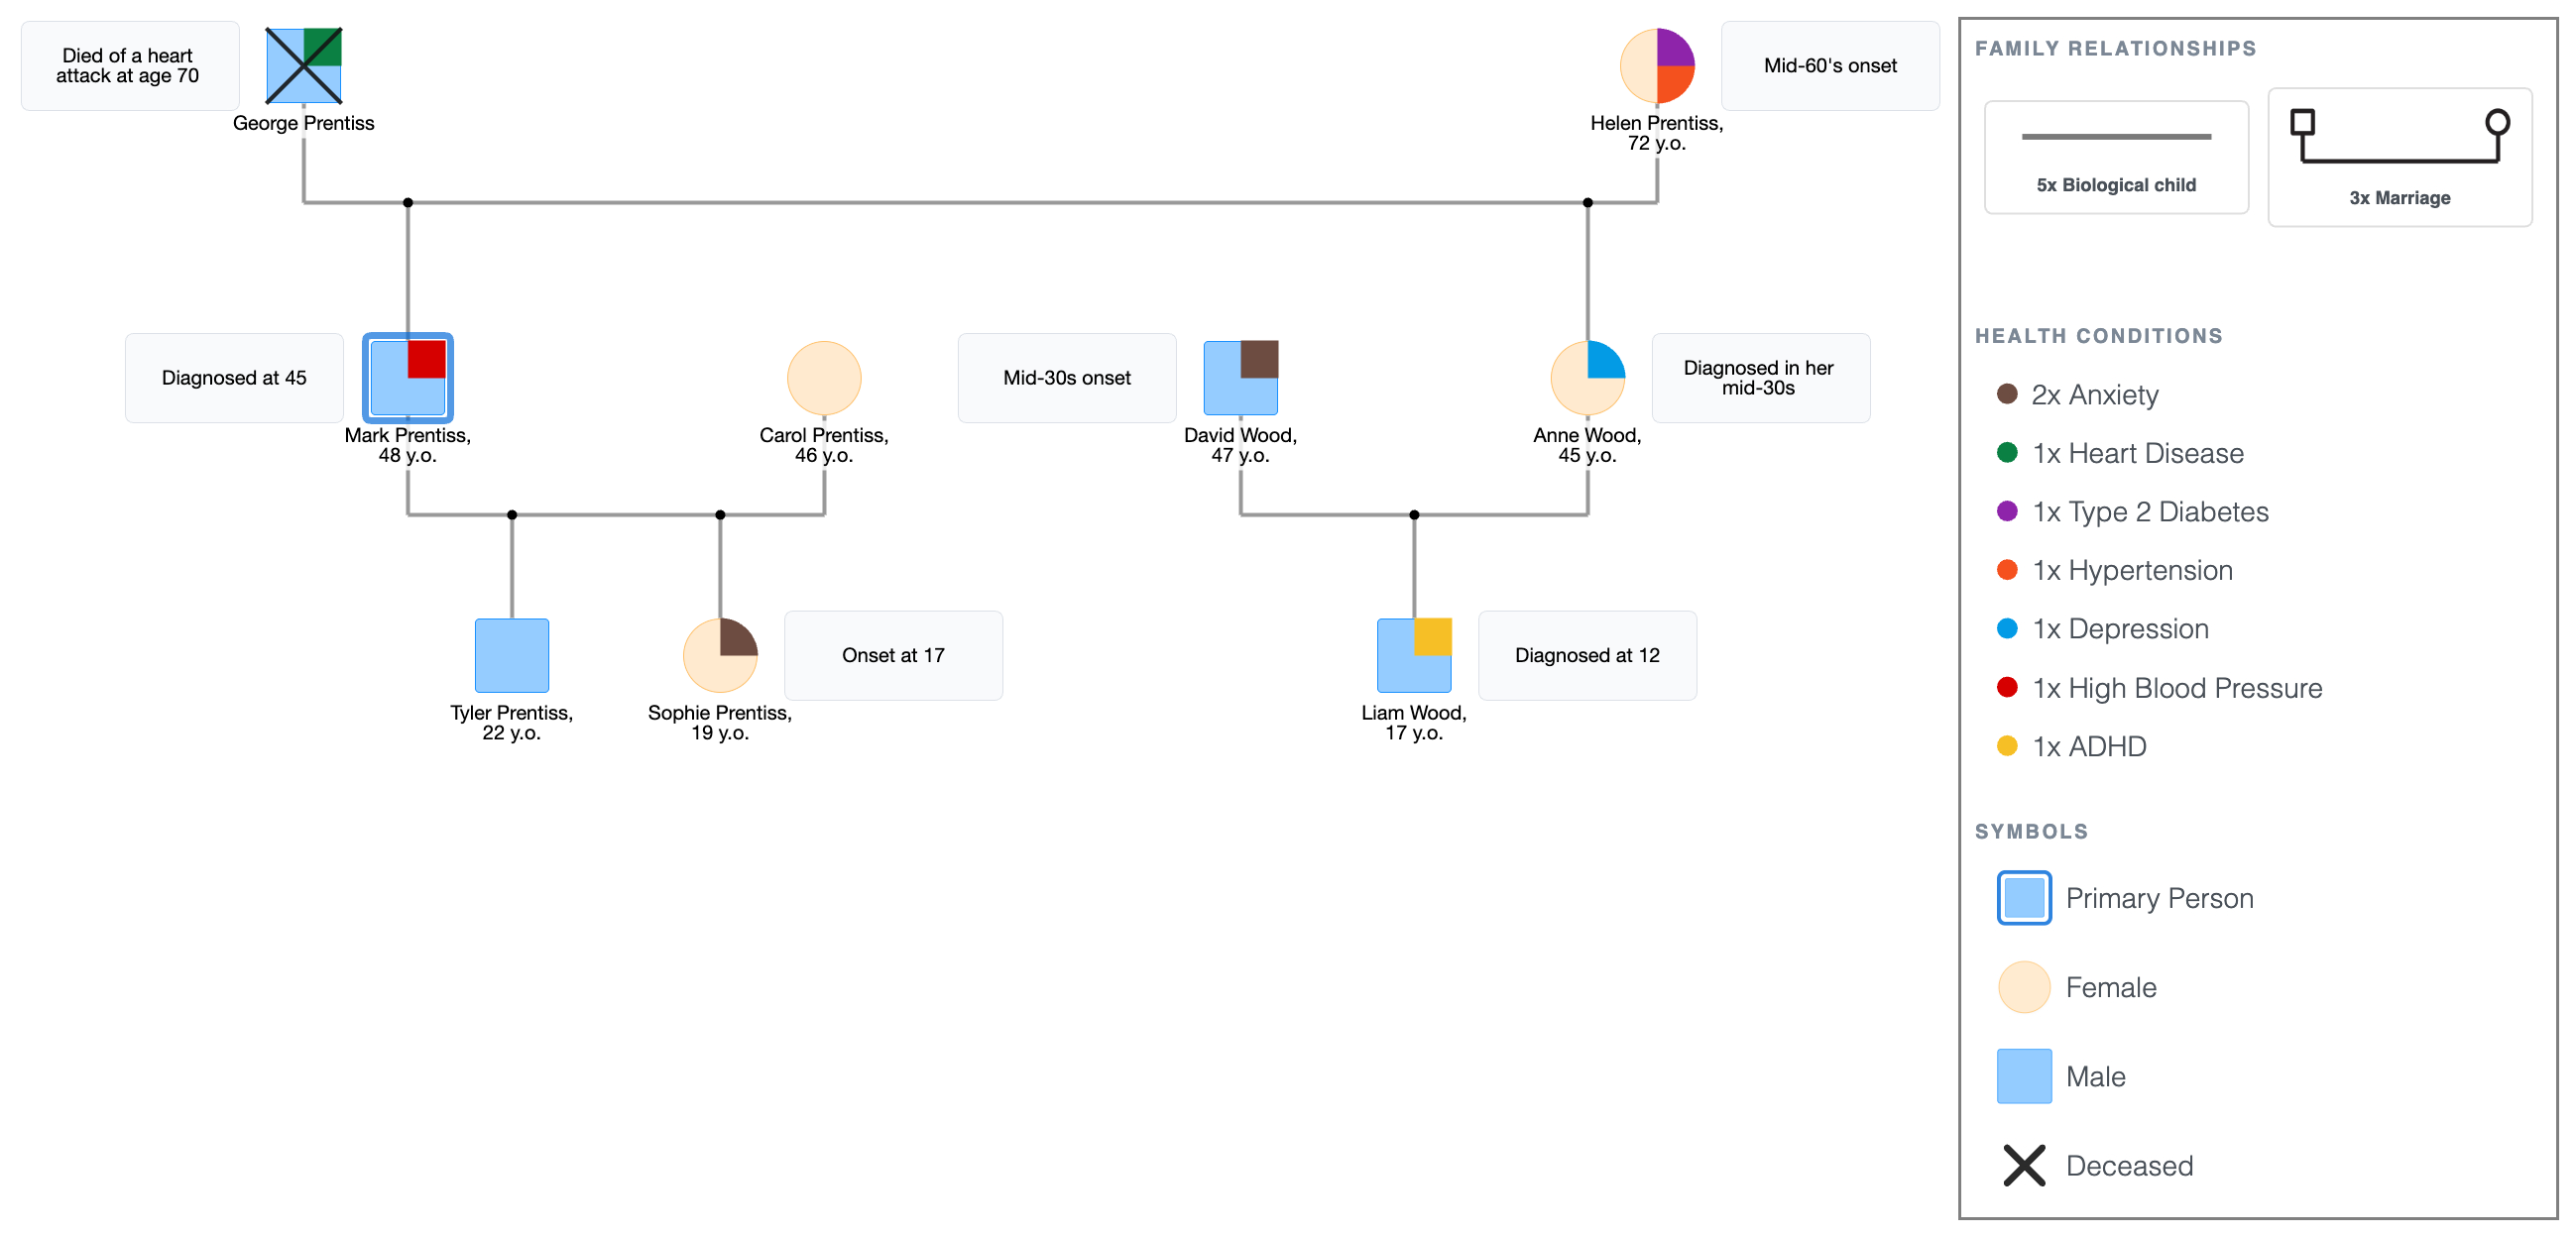
Mark's diagnosis at 45, compared to his father's fatal event at 70, is the kind of thing the diagram surfaces once you put the ages in. The same organ system, but 25 years earlier in Mark's life.
The same logic applies on the mental health side: Sophie's anxiety at 17 and Liam's ADHD at 12 sit visibly below parents who were diagnosed in their mid-30s (in Sophie's case, her aunt). Whether that gap narrows in the next generation is a question the diagram lets you ask.
It's important to add the ages of the family members. If you don't know the exact age, write an approximate range. Leave it blank only as a last resort; even "mid-40s" is more useful than nothing.
Step 5: Read the patterns
Step back and look at the completed diagram as a whole.
This is what a medical genogram is for, not just for any single person's history, but what becomes visible across generations when you put everyone on the same page.
Cardiovascular thread:
- George died of a heart attack at 70.
- His son Mark was diagnosed with high blood pressure at 45, earlier in life, but in the same organ system.
- Tyler, at 22, sits at the base of that line with no conditions yet, but he now has to be mindful because of his family history.
Metabolic thread:
- Helen carries both type 2 diabetes and hypertension.
- Both conditions share known risk factors with cardiovascular disease.
- Mark's hypertension connects to both his father's cardiac history and his mother's metabolic profile simultaneously; a connection that's easy to miss in a written health history but visible at a glance in the diagram.
- Anne and Sophie also share this risk from their maternal side.
Mental health thread:
- Anne has depression.
- Her husband, David, has anxiety.
- Their son, Liam, has ADHD.
- Sophie, Anne's niece, also has anxiety.
Unlike the cardiovascular thread, where Tyler has no diagnosis yet, the mental health thread has already reached the third generation on both sides; Sophie is 19, and Liam is 12. It isn't something to watch for; it's already there.
For condition-specific layouts and ready-made health-focused structures, compare the full Genogram Examples hub with the editable samples inside the Free Genogram Maker.
Prentiss-Wood Family Genogram Showing Medical Conditions and Ages
Explore this genogram and adapt it to your needs.
Step 6: Before You Call It Done
Run through this checklist before submitting or sharing the diagram.
- Every person has a name and a gender symbol.
- Deceased members are marked with an X and have the cause of death noted.
- Conditions are labeled specifically, not generically ("type 2 diabetes," not "diabetes").
- Age of onset is included where available.
- The legend accounts for every condition and symbol used.
- The primary person has a double outline.
- Each generation sits on the same horizontal level.
FAQ
What is a medical genogram used for?
A medical genogram maps a family's health history across generations, usually three or more, using standardized symbols. Doctors, genetic counselors, therapists, and social workers use them to spot hereditary conditions, identify risk patterns, and inform treatment or preventive care. Students also build them for class assignments in nursing, social work, and psychology programs.
What health conditions should I include in a medical genogram?
Include diagnosed conditions, cause of death for deceased members, and age of onset where you have it. Common categories are cardiovascular conditions, metabolic conditions like diabetes, cancers, mental health diagnoses, and substance use. What you prioritize depends on the purpose, as a genetic counseling intake focuses differently from a therapy session or a class project.
How many generations does a medical genogram need?
Three is the standard and the minimum for pattern recognition. Two generations rarely show enough to identify what repeats. Four or more is useful for hereditary conditions with strong genetic components, like certain cancers or early-onset heart disease, where skipped generations can still be informative.
What are the symbols used in a medical genogram?
Medical genograms use the same base symbols as any genogram; squares for males, circles for females, an X through a shape for deceased, with health conditions added as labels, color-coded markers, or shading.
Can I make a medical genogram for free?
Yes. EasyGenogram is free to use. You can build from scratch, add health conditions directly to each person, and export as PDF or PNG when done.
Sources
- Genograms: Assessment and Treatment (4th ed.)
- Genograms for Psychotherapy