Appearance
Family Genogram Example
A family genogram shows a real family across multiple generations, including structure, relationship quality, and health history on the same page. If a family tree tells you who belongs to the family, a family genogram tells you how that family actually works and what patterns repeat across generations.
Example 1 - Family Genogram with Health History: The Norton Family
Family Genogram with Health History: The Norton Family
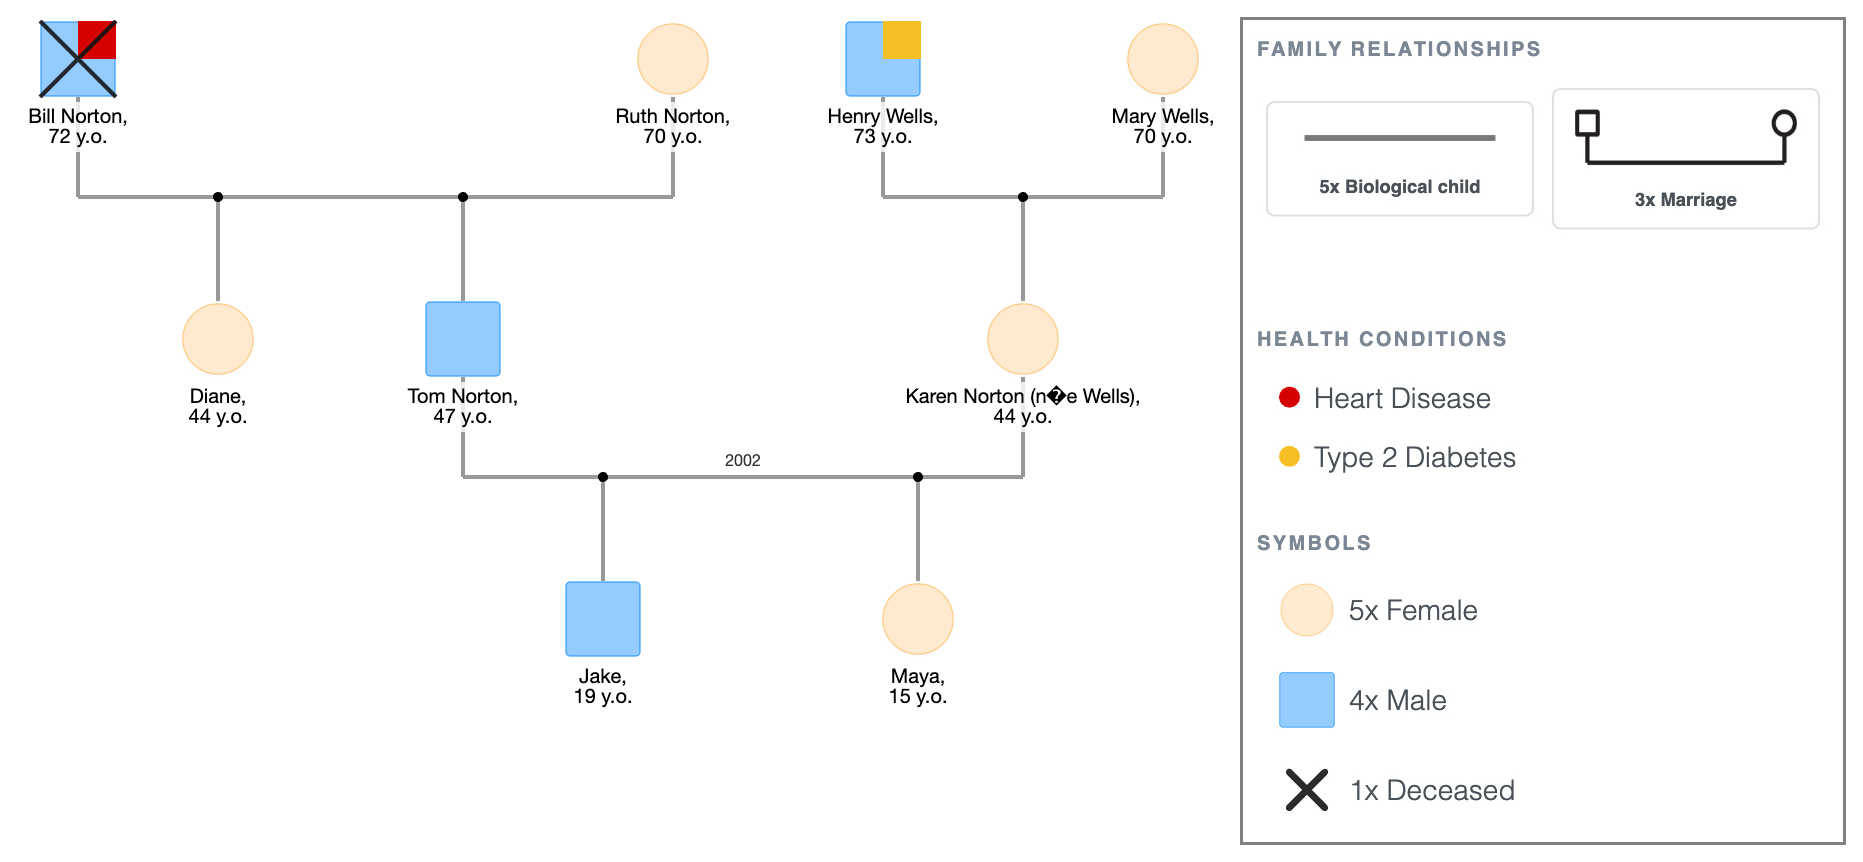
The family:
- Tom Norton, 47, and his wife Karen Norton (née Wells), 44, have been married since 2002.
- They have two children: Jake, 19, and Maya, 15.
- Tom's parents: Bill Norton (deceased, heart disease, age 72) and Ruth Norton, 70.
- Karen's parents: Henry Wells, 73 (type 2 diabetes) and Mary Wells, 70.
- Tom has one sibling: his sister Diane, 44.
What you can now see:
- Bill's square has an X through it, with heart disease noted beside it. Henry's diabetes appears on the opposite side of the diagram. Two conditions, two sides of the family, both visible on the same page at once.
- Jake and Maya sit at the bottom of three generations of health history that's now documented. A doctor asking about family background gets this picture immediately, without relying on what anyone happens to remember in the moment.
This is what most family genograms look like before anything dramatic has happened: a complete, readable picture of a family that a written description would take several paragraphs to convey.
Family Genogram with Health History: The Norton Family
Explore this genogram and adapt it to your needs.
Example 2 - Family Genogram After a Death: The Grey Family
Family Genogram After a Death: The Grey Family
The family:
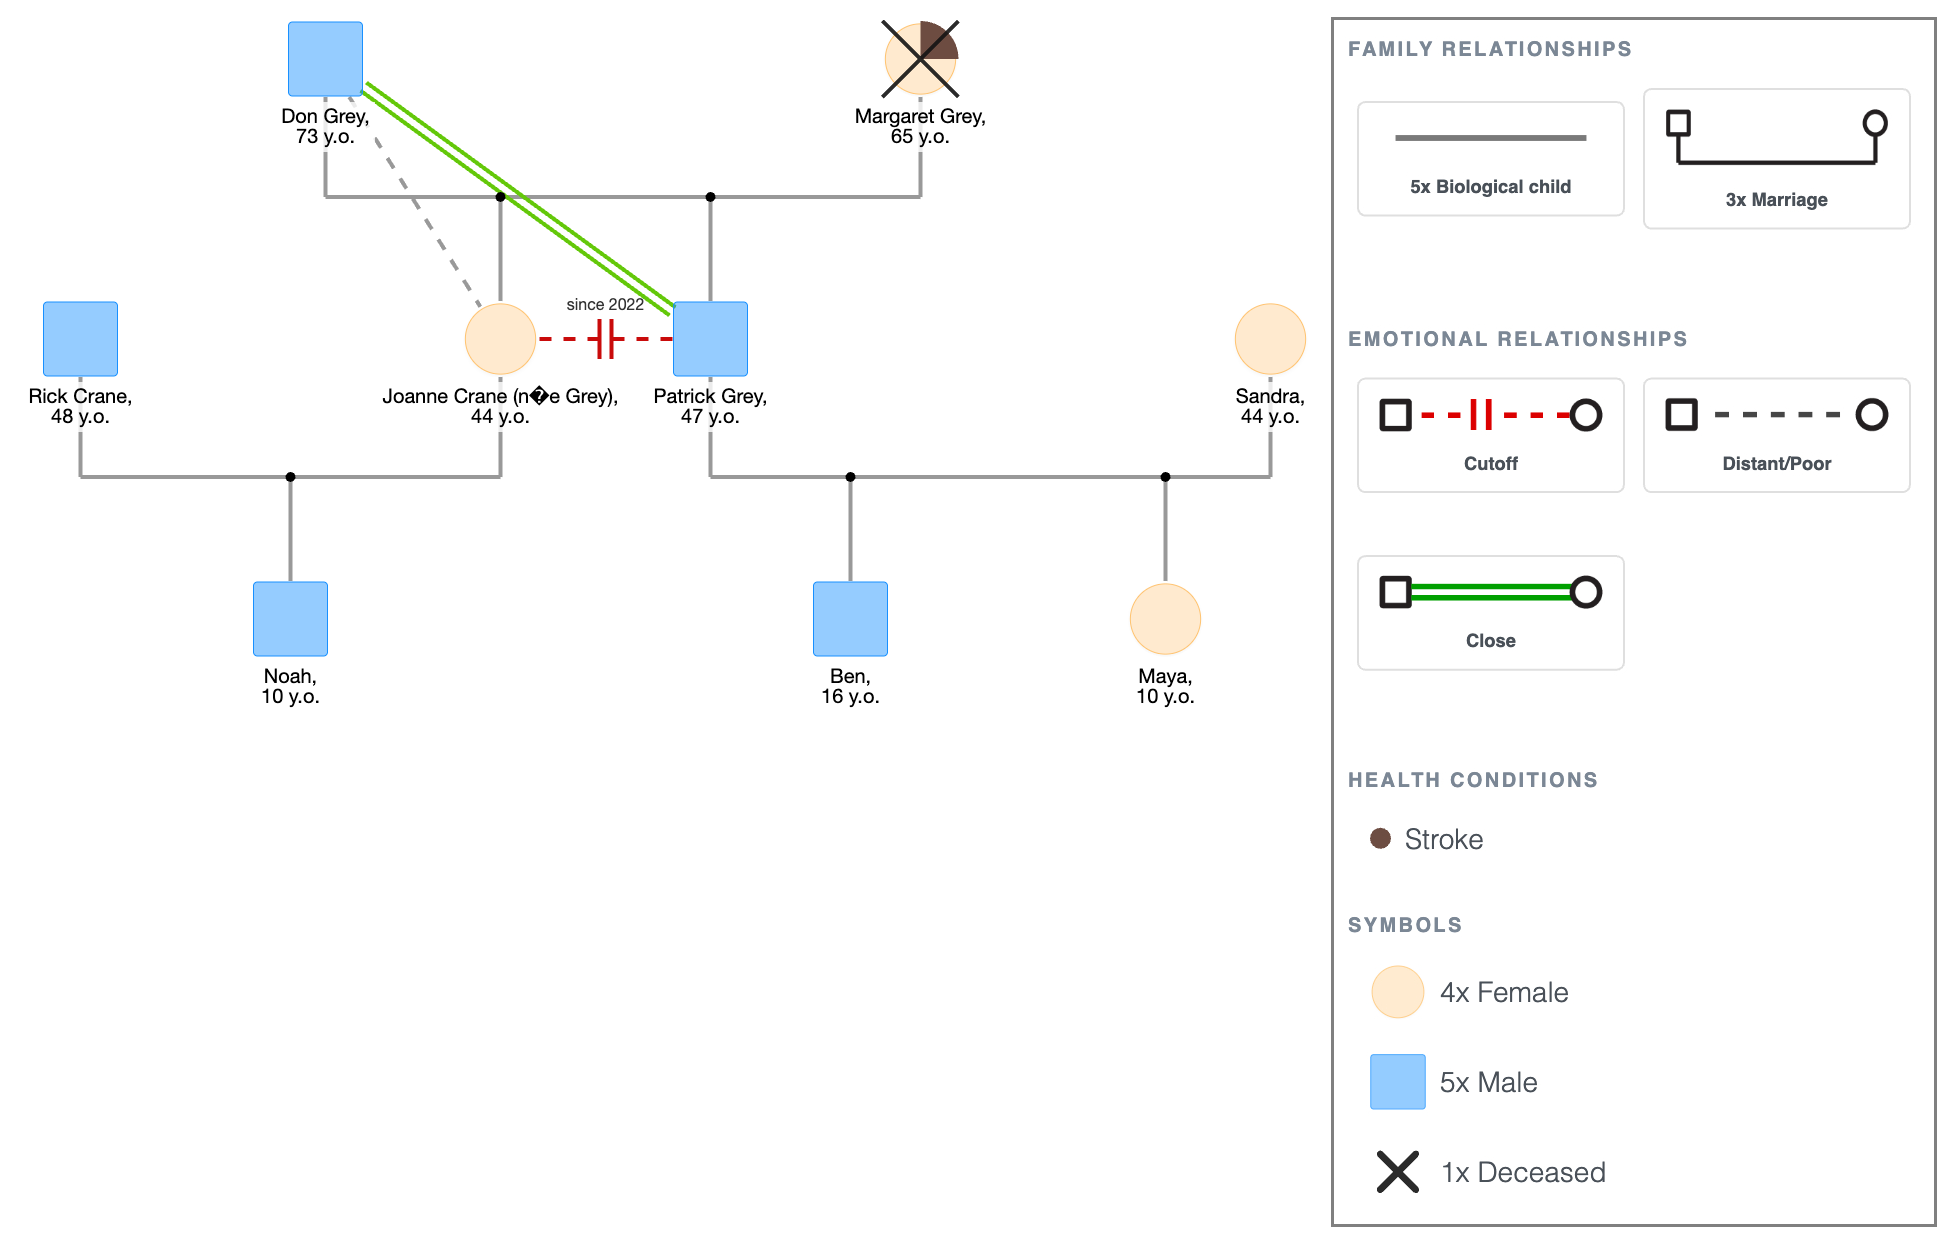
- Margaret Grey (deceased, 2022, stroke, age 65) and her husband Don Grey, 73.
- Two adult children: Patrick Grey, 47, and his sister Joanne Crane (née Grey), 44.
- Patrick and his wife Sandra have two children: Ben, 16, and Lily, 12.
- Joanne and her husband Rick, 48, have one child: Noah, 10.
- Since Margaret's death, Patrick and Joanne have not spoken; what started as a dispute over the estate has become a full estrangement. Cutoff line between them.
- Don has a close relationship with Patrick and a distant relationship with Joanne since the falling out.
What you can now see:
- Margaret's symbol carries the most weight in this diagram. Her X mark and death year sit at the top, but her absence runs through every relationship line below it.
- The cutoff between Patrick and Joanne sits in the middle of the diagram, visually splitting the family into two branches.
- Don's close line to Patrick and distant line to Joanne shows that he has been pulled into the estrangement; he is closer to one child than the other, and the genogram makes that visible.
- Ben, Lily, and Noah appear at the bottom: three cousins who share a grandfather and a cutoff between their parents. The genogram shows what the children are also navigating, not just what the adults are doing.
Family Genogram After a Death: The Grey Family
Explore this genogram and adapt it to your needs.
Example 3 - Family Genogram with a Repeating Pattern: The Lane Family
Family Genogram with a Repeating Pattern: The Lane Family
The family:
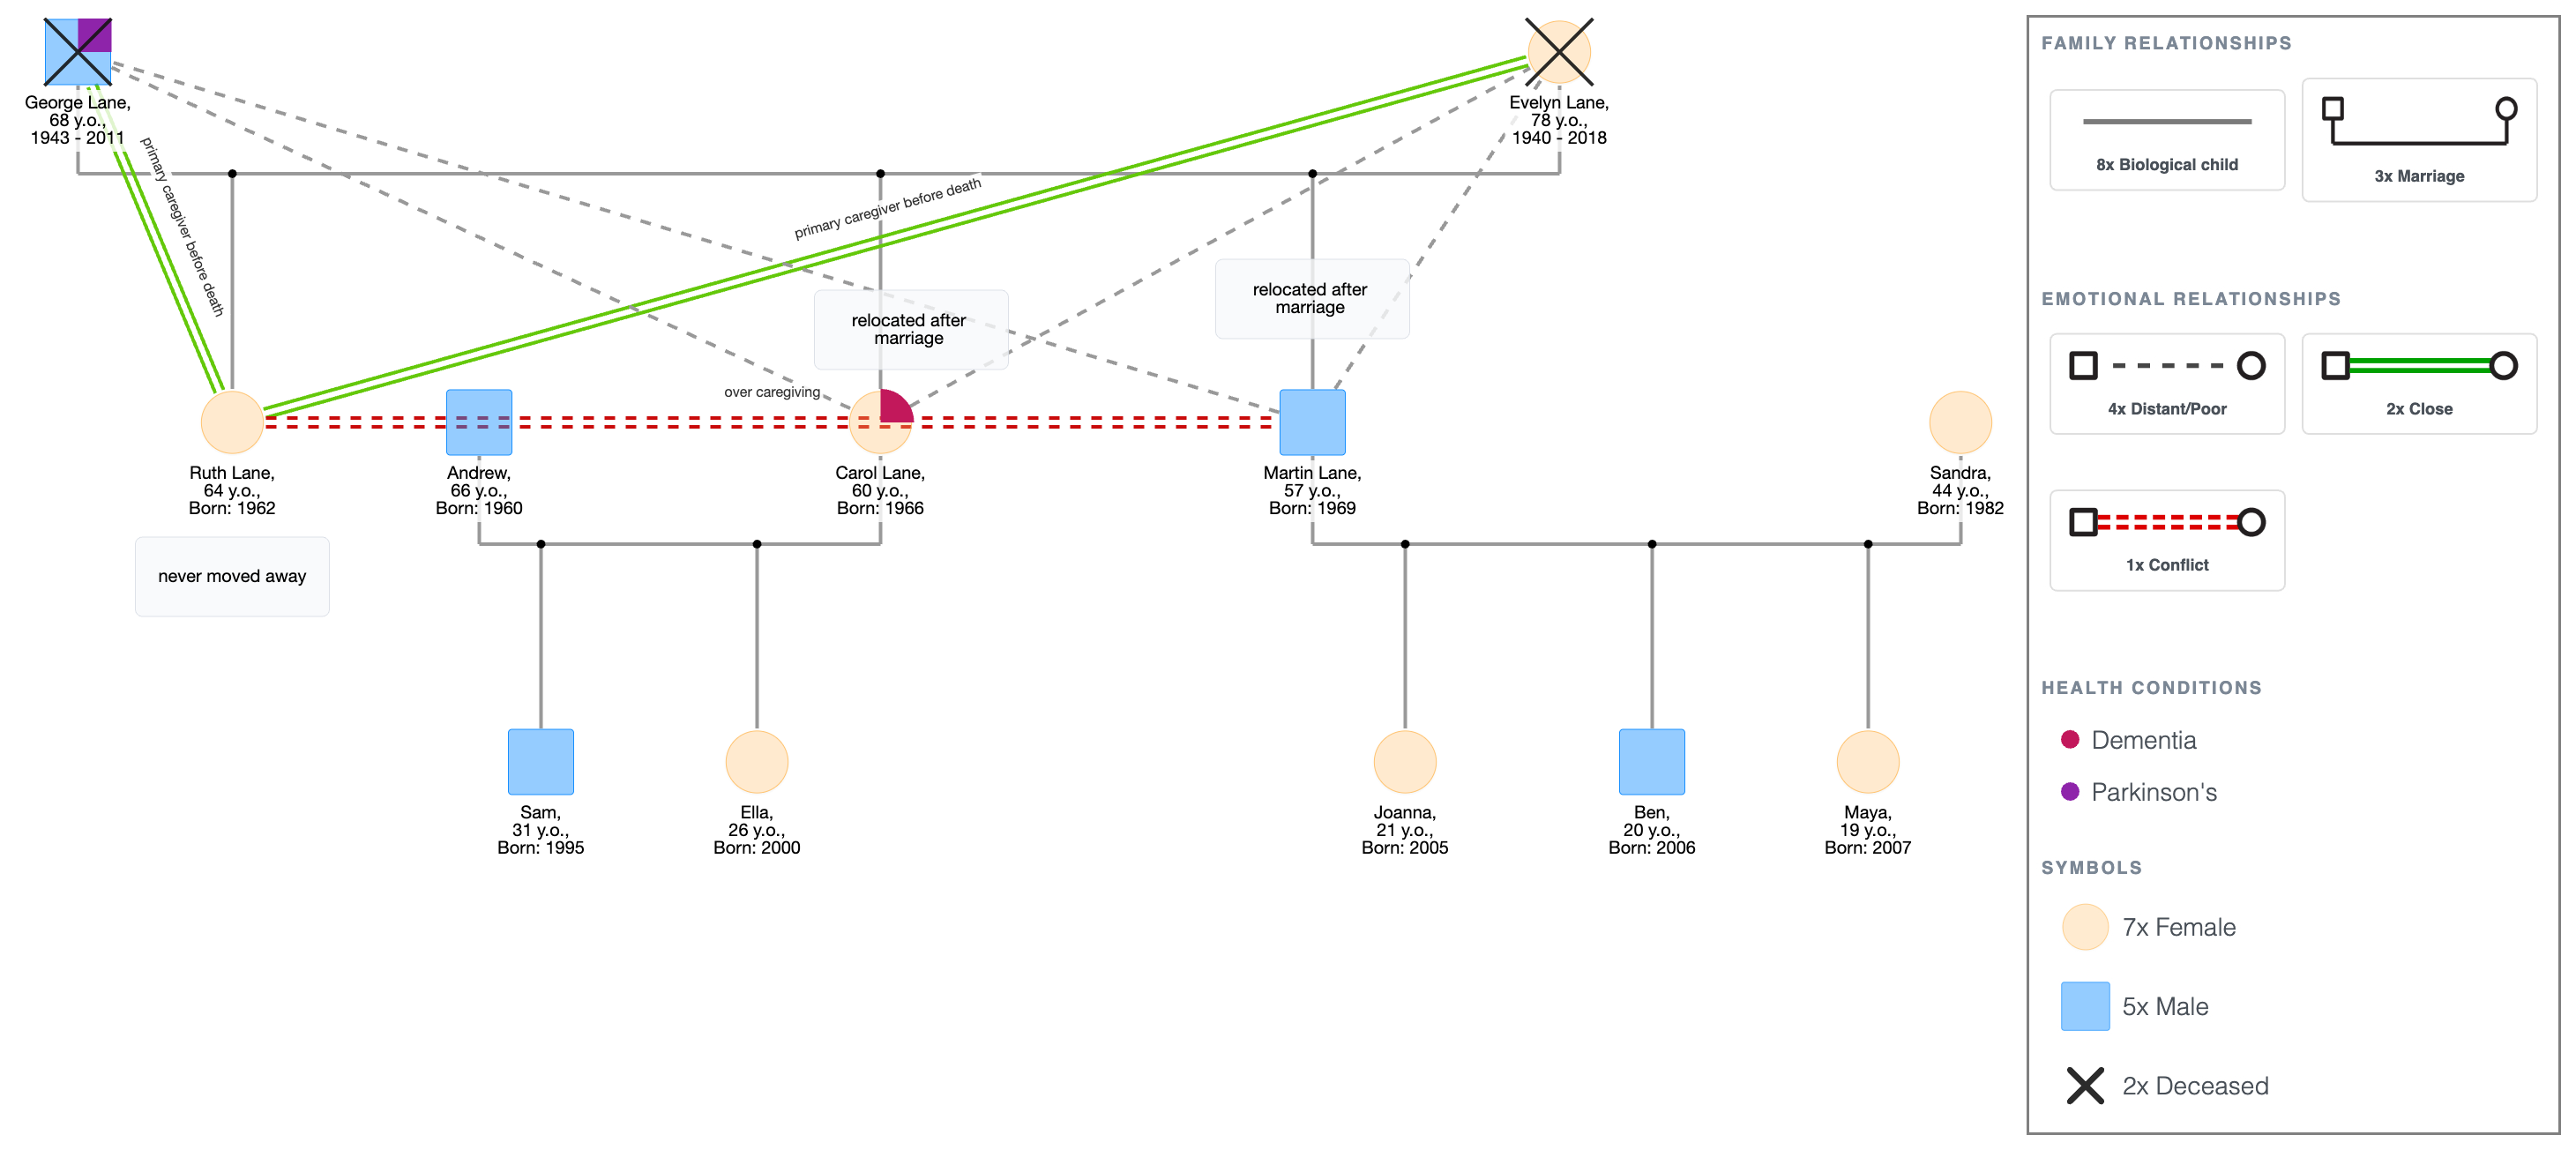
- George Lane (deceased, 2011, Parkinson's disease, age 68) and his wife Evelyn Lane (deceased, 2018, age 77).
- Three children: Ruth Lane, 64 (eldest, never married); Carol Lane, 60; Martin Lane, 57.
- Ruth was George's primary caregiver before he died, and then Evelyn's. She lives close to where the family grew up. Close lines to both parents.
- Carol and Martin both married and moved away. Distant lines to both parents; geographical, not hostile.
- Carol has two adult children. Martin has three.
- Now Carol is showing early signs of dementia. Martin and Carol expect Ruth to take on the caregiver role again. Conflict line between Ruth and Martin over this.
What you can now see:
- Ruth appears in the middle of the diagram; she is the person the family routes everything through, and the genogram makes that structural fact impossible to miss.
- George's Parkinson's notation and Evelyn's death year sit in the top row. What those facts don't show, but the relationship lines do, is that George's illness and Evelyn's death were experienced completely differently by the three children. Ruth was present for both. Carol and Martin were not.
- The conflict line between Ruth and Martin is the most recent addition to the diagram. It sits at the bottom; the current pressure point. The genogram shows where tension is building before it becomes the thing the family has to address.
- If Carol's mother followed a similar pattern (an eldest sibling absorbing the family's caregiving burden) adding a fourth generation to this diagram would show a transmission pattern.
Family Genogram with a Repeating Pattern: The Lane Family
Explore this genogram and adapt it to your needs.
What a Family Genogram Includes
A complete family genogram usually covers:
- Family members across at least two to three generations, with names and ages.
- Structural lines of marriages, parent-child connections, sibling lines, divorces with dates.
- Deceased members, with cause of death where known.
- Health conditions, noted beside the relevant person.
- Significant life events (estrangements, remarriages, major losses) with dates.
- Emotional relationship lines for the relationships that matter most (close, distant, conflict, cutoff).
- A legend listing what each symbol and line type represents.
Not every genogram needs a lot of layers.
For instance, a health-focused genogram might skip relationship lines entirely. An assignment genogram might include two or three relationship lines and leave the rest undrawn.
Start with the information you have, and add layers where they're useful.
For a full breakdown of what each symbol means, see the genogram symbols guide.
When to Use a Family Genogram
- Academic assignments: social work, nursing, psychology, and counseling courses commonly assign three-generation family genograms as self-awareness or case study exercises.
- Therapy intake: mapping a client's family at the start of sessions gives the therapist a picture of the system and not just the individual.
- Medical history documentation: tracking hereditary conditions across generations for a GP, specialist, or genetic counselor.
- Personal records: documenting a family's structure and history before the people who remember it are no longer around.
When Not to Use
- When the family is blended: divorces, remarriages, step-siblings, and split households need a different structure; see the blended family genogram example.
- When conflict is the central focus: if you're specifically mapping persistent tension across the family, the genogram with conflict example covers that in more depth.
- When two generations is enough: if the goal is to show the current household and immediate relationships only, a simple genogram is faster and cleaner.
- When a clinical interpretation layer is required: for social work assessments that need to explain what the genogram reveals at each step, see the genogram for social work assessment.
How to Draw a Family Genogram
You can edit any of the examples above in EasyGenogram, or start from scratch following these steps:
- Place your primary person: start with whoever the genogram is about and put them in their generation. Everything else is built around them.
- Add parents and siblings: place parents in the row above, connected by a marriage line. Add siblings beside the primary person on the same row, oldest on the left.
- Add grandparents: go up one more level. Add both sets of grandparents and connect them to their children.
- Add health conditions and life events: once the structure is in place, note health conditions beside relevant members. Add death years, causes, divorce dates, and any significant events.
- Add relationship lines: draw emotional connections where they matter: close, distant, conflict, cutoff. Keep it to the relationships that are significant, not every pair on the diagram.
- Export your genogram: download as PDF or PNG, ready for an assignment, a session, or your own records.
For a more detailed walkthrough, see the full how to make a genogram guide.
FAQ
What is a family genogram?
A family genogram is a diagram that maps a family across multiple generations using standardized symbols. It shows who the members are, how they're related structurally, the quality of major relationships, and relevant health or life history. It covers more ground than a family tree because it includes how the family functions, not just who belongs to it.
How is a family genogram different from a family tree?
A family tree records lineage and includes names, dates, and descent. A family genogram adds the relational layer: whether relationships are close, distant, conflictual, or cut off, alongside health history and significant life events. A family tree shows the structure; a genogram shows what's happening inside it.
What should a family genogram include?
At minimum, it should include three generations of family members with names and ages, structural lines showing relationships and marriages, and a legend. For most academic and clinical purposes, you'll also want health conditions noted, at least one or two emotional relationship lines, and significant events like deaths or divorces with dates. The examples on this page include all of these.
How many generations should a family genogram have?
Three is the standard minimum for clinical and academic work. Two generations show who's in the current family; three generations are where patterns start to become visible; repeating health conditions, relationship dynamics, behavioral tendencies. If you only have information for two generations, start there and add the third as you gather more.
Can I use a family genogram example for a social work or school assignment?
Yes. The examples on this page cover the elements most assignments ask for; three generations, structural connections, health history, and relationship lines.
Sources
- *Genograms: Assessment and Intervention* (3rd ed.). W.W. Norton & Company.
- *Family Therapy in Clinical Practice*. Jason Aronson.