Appearance
Genogram Examples in Real Life
Genogram examples are useful when you need to see how a family actually functions, not just who belongs to it. The three examples on this page show that in practice: one organizes family history for memoir work, one clarifies caregiving conflict, and one maps a biological family before first contact.
If you need a more conventional starting point before these narrative examples, use the basic genogram example for a stripped-back three-generation layout or the family genogram example for fuller family-health and loss scenarios.
Example 1 - The Memoir Writer: The Webb Family
Clare Webb, 45, has been collecting other family stories for years.
When she started writing hers, she kept losing track of which branch a story belonged to and why certain relatives had almost nothing on record.
She built a genogram and found the answer in the diagram.
The Memoir Writer: The Webb Family Genogram Example
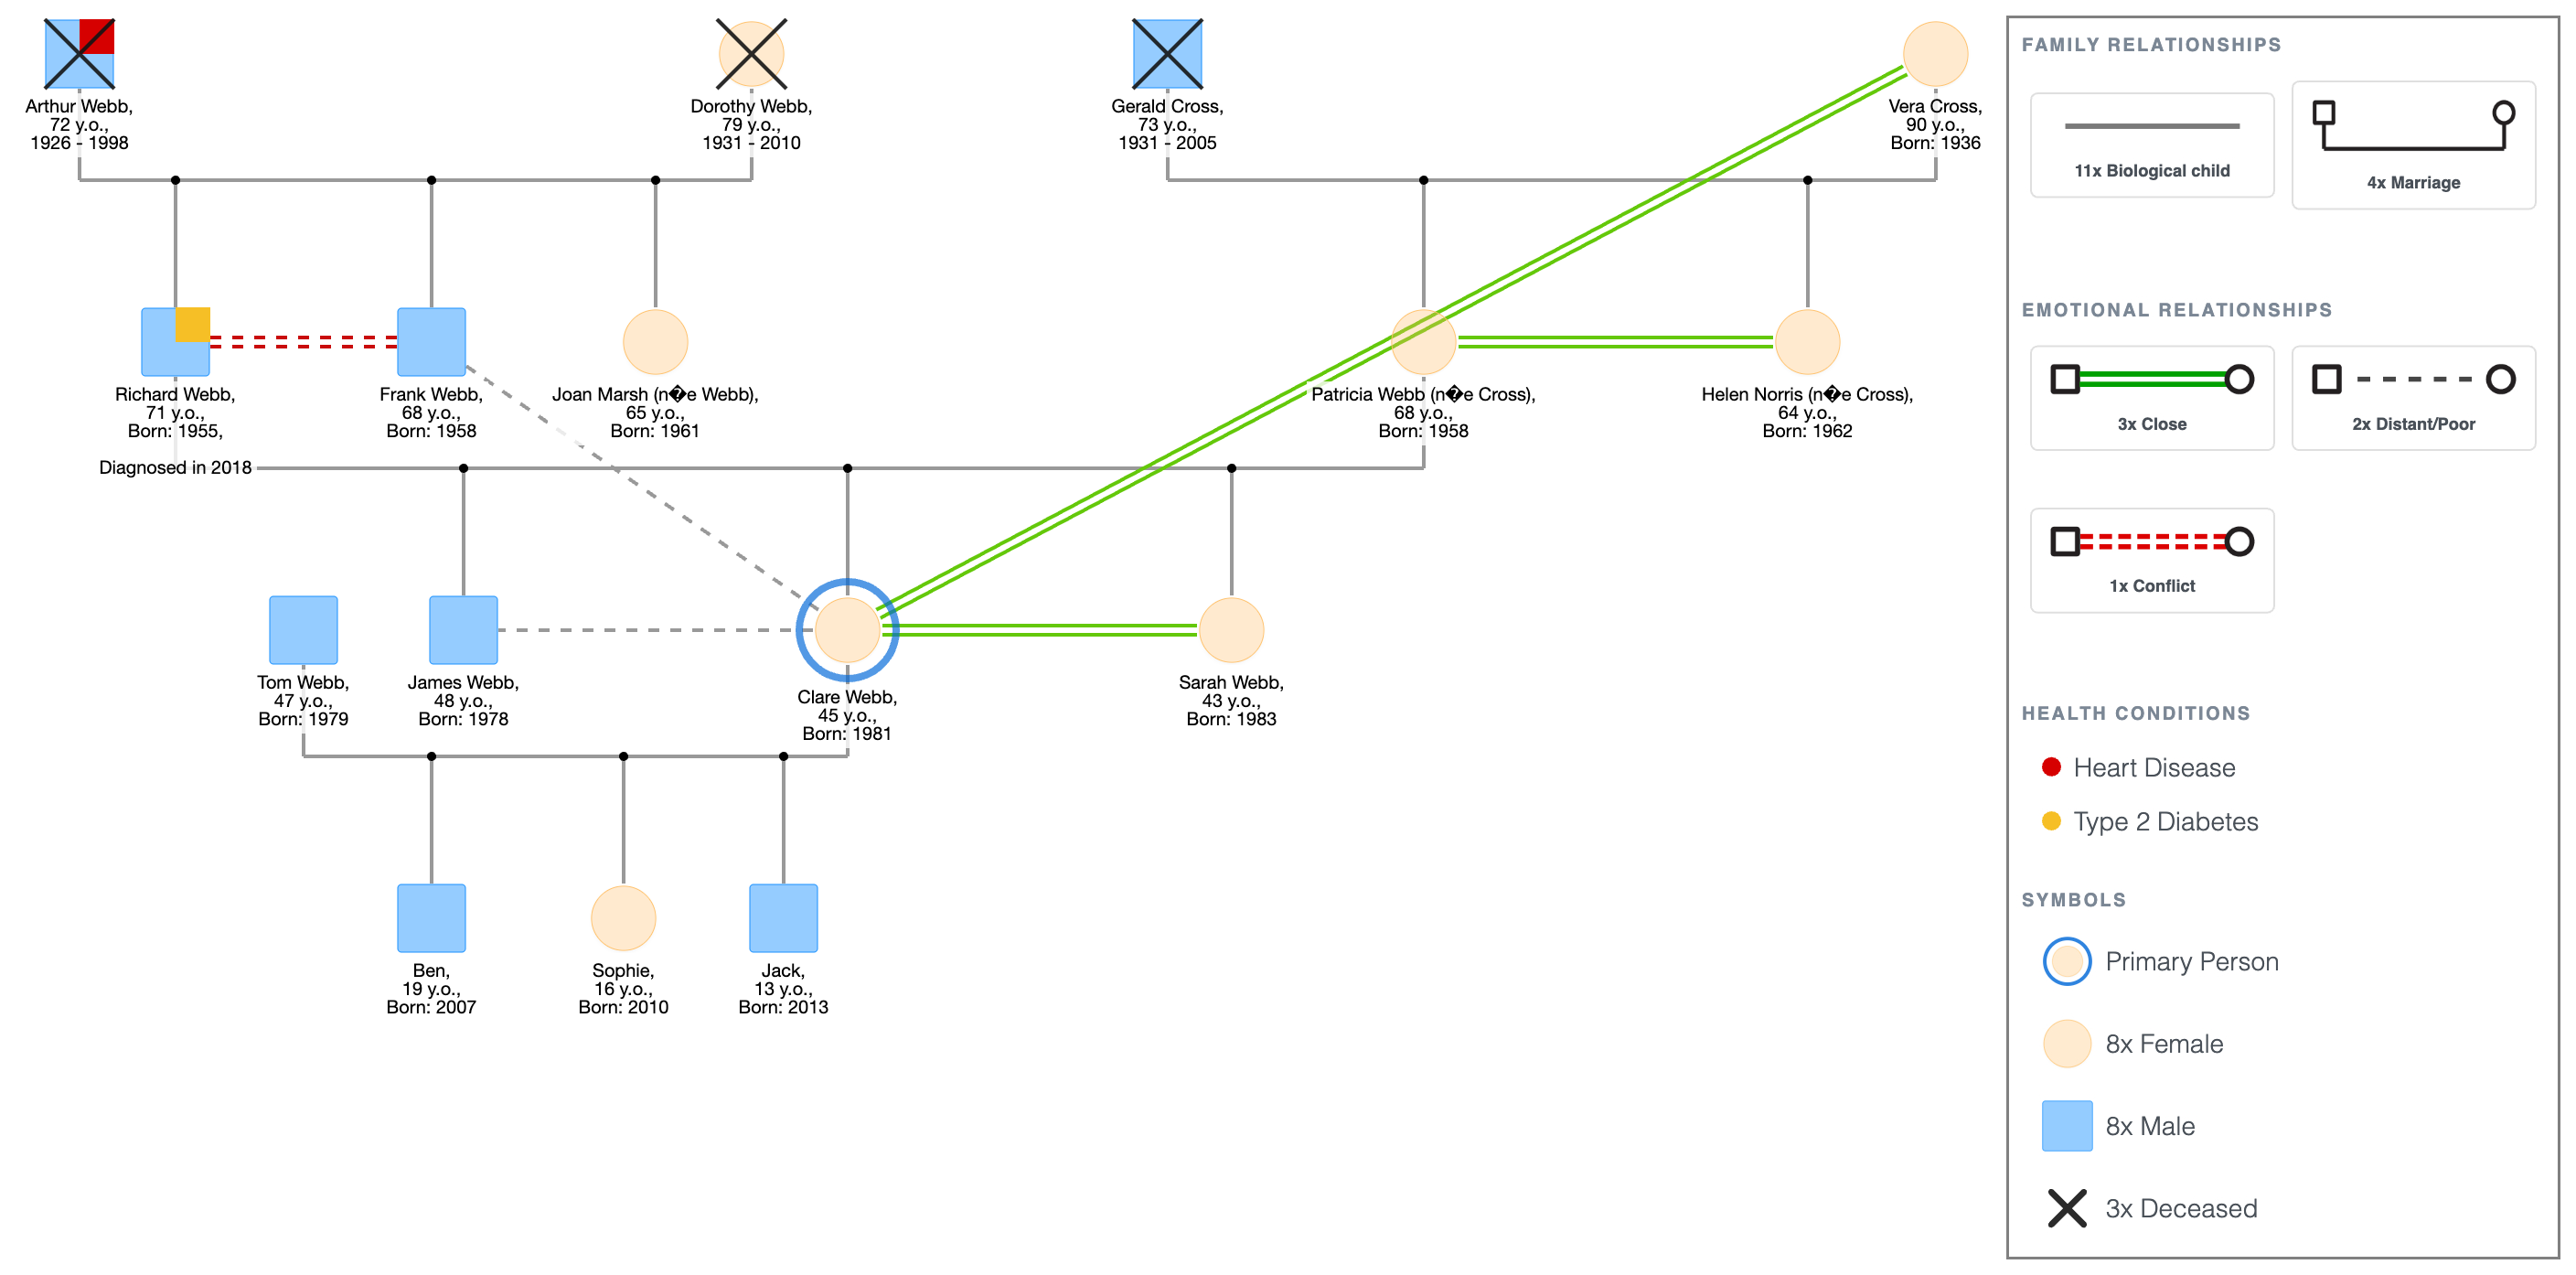
The family:
- Clare Webb, 45, is the primary person. Married to Tom Webb, 47. Three children: Ben, 19; Sophie, 16; Jack, 13.
- Clare's parents: Richard Webb, 71 (type 2 diabetes, diagnosed 2018) and Patricia Webb (née Cross), 68.
- Richard's siblings: Frank Webb, 68, and Joan Marsh (née Webb), 65. Conflict line between Richard and Frank; long-standing, origin unclear to Clare's generation. Distant line between Clare and Frank.
- Richard's parents: Arthur Webb (deceased, 1998, heart disease, age 72) and Dorothy Webb (deceased, 2010, age 79).
- Patricia's parents: Gerald Cross (deceased, 2005, age 73) and Vera Cross, 90. Close line between Clare and Vera.
- Patricia's sibling: Helen Norris (née Cross), 64. Close line between Patricia and Helen.
- Clare's siblings: James Webb, 48, and Sarah Webb, 43. Close line between Clare and Sarah. Distant line between Clare and James.
What the genogram showed:
- The conflict line between Richard and Frank sits in the second generation, running between two brothers. Clare had always known they weren't close. The genogram showed her that Frank's branch, the underdocumented side of the Webb family, was underdocumented for a reason. The stories stopped flowing at a conflict she had never asked about directly.
- Arthur and Dorothy are both gone. Frank and Joan are the only living people who knew that generation of Webbs as adults. The conflict line between Richard and Frank is also a line between Clare and the last people who can fill that gap. The diagram made the access problem visible as a structural fact.
- Vera is 90 and has a close line to Clare. Gerald is gone. On the Cross side, the documentation is deep because the relationship was close. On the Webb side, it is thin because the relationship was not. The genogram showed Clare the shape of what she had, and why.
- Richard's diabetes is noted beside his symbol. Arthur died of heart disease. Clare is writing a family memoir; that thread is now in the diagram alongside everything else, ready to include or set aside depending on where the writing goes.
The Memoir Writer: The Webb Family Genogram Example
Explore this genogram and adapt it to your needs.
Example 2 - The Family Dispute: The Harmon Family
David Harmon, 55, has been managing his mother's care for eighteen months.
When his siblings joined a video call to discuss next steps, the conversation went in circles.
David built a genogram and shared it before the next meeting.
The Family Dispute: The Harmon Family Genogram Example
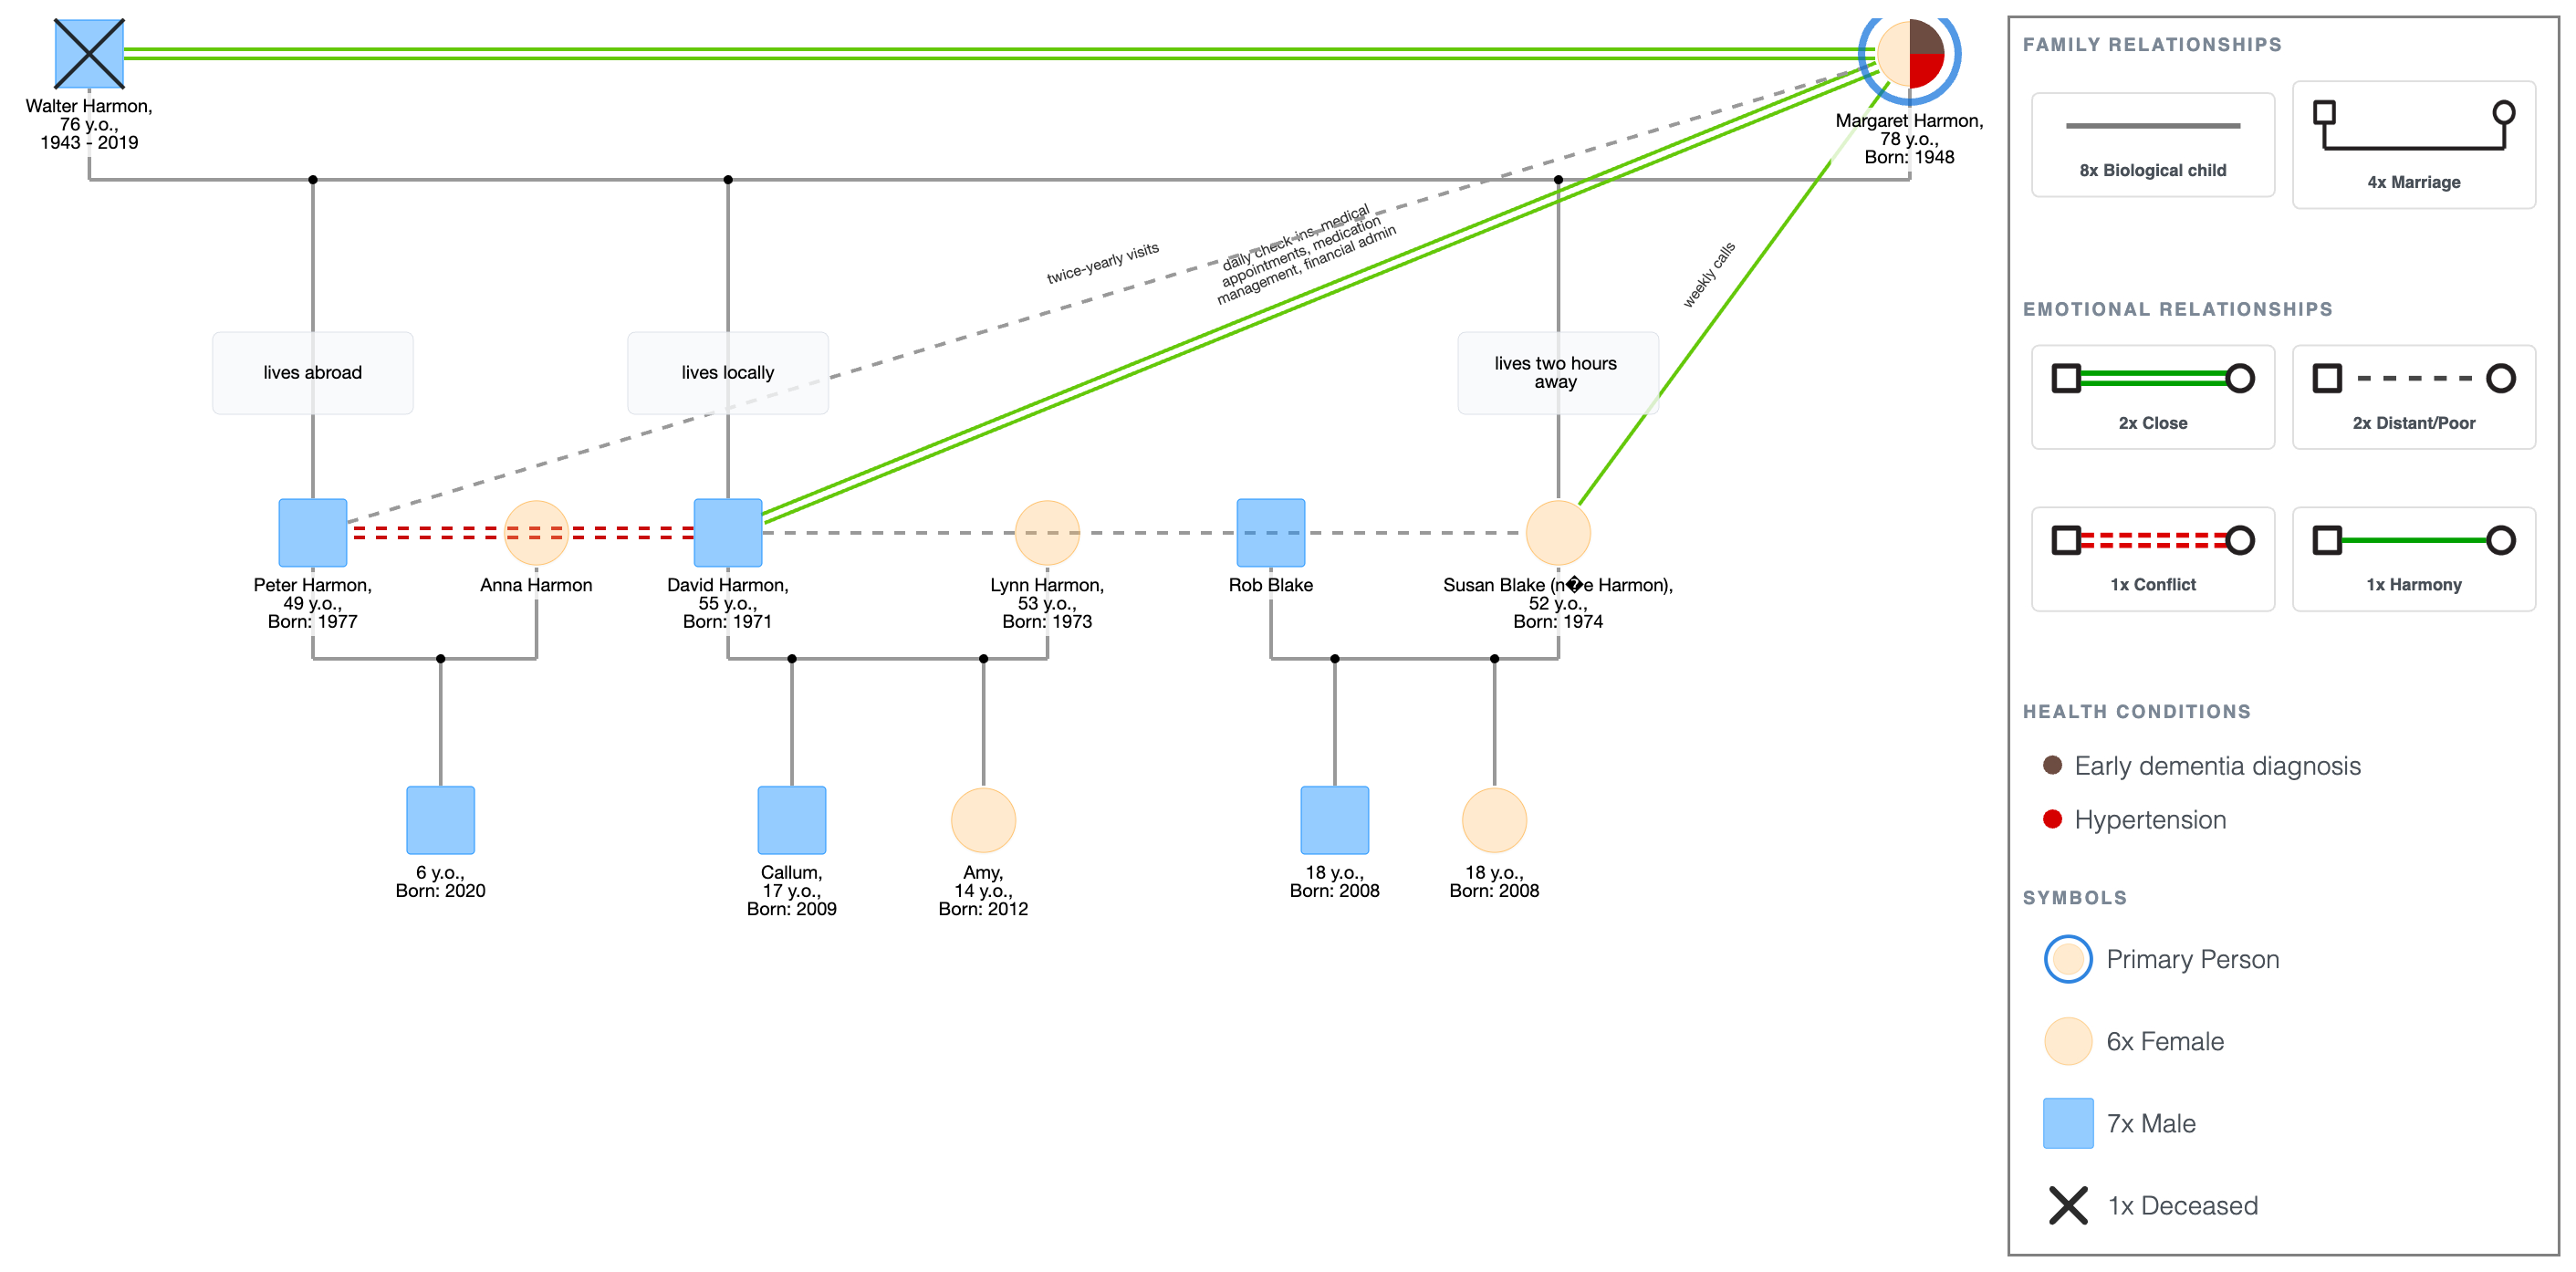
The family:
- Margaret Harmon, 78, primary person. Early dementia diagnosis, 2024. Hypertension, managed.
- Margaret's husband: Walter Harmon (deceased, 2019, heart disease, age 76). Close line between Walter and Margaret.
- Three children: David Harmon, 55 (lives locally); Susan Blake (née Harmon), 52 (lives two hours away); Peter Harmon, 49 (lives abroad).
- David married Lynn Harmon, 53. Two children: Callum, 17; Amy, 14. Close line between David and Margaret.
- Susan married Rob Blake. Two adult children. Distant line between David and Susan.
- Peter married Anna Harmon. One child. The conflict between David and Peter escalated during the care discussions.
- Responsibility notes beside David's symbol: daily check-ins, medical appointments, medication management, financial admin.
- Contact frequency noted beside Susan and Peter: weekly calls (Susan), twice-yearly visits (Peter).
What the genogram showed:
- The conflict line between David and Peter sits in the same generation as the distant line between David and Susan. Both lines run from David outward. The diagram showed that David is not in an easy relationship with either sibling, and that the care discussions did not create that difficulty, they surfaced it.
- Walter's heart disease is noted in the top row. Margaret has hypertension. Both conditions are documented. Margaret's current health sits in a context the genogram holds.
- Walter died in 2019. Margaret's dementia diagnosis came in 2024. Five years between the two events. David's close line to Margaret predates both. The diagram showed that the current arrangement; David as the closest child and primary point of contact, did not begin when the diagnosis arrived.
- Susan wanted Margaret in a care home. Peter wanted increased in-home support. The responsibility notes beside David's symbol listed what was already happening every day. The genogram moved the conversation from what each sibling preferred to what the diagram showed was already true and happening.
The Family Dispute: The Harmon Family Genogram Example
Explore this genogram and adapt it to your needs.
Example 3 - The Adoptee: The Brennan Family
Tom Brennan, 34, was adopted at birth. He had a name and a phone number for his biological mother for three years before he called.
When he finally did, Rachel answered.
Two weeks before their first meeting, Tom built a genogram from the agency file and what Rachel had shared in their first conversation.
The Adoptee: The Brennan Family Genogram Example
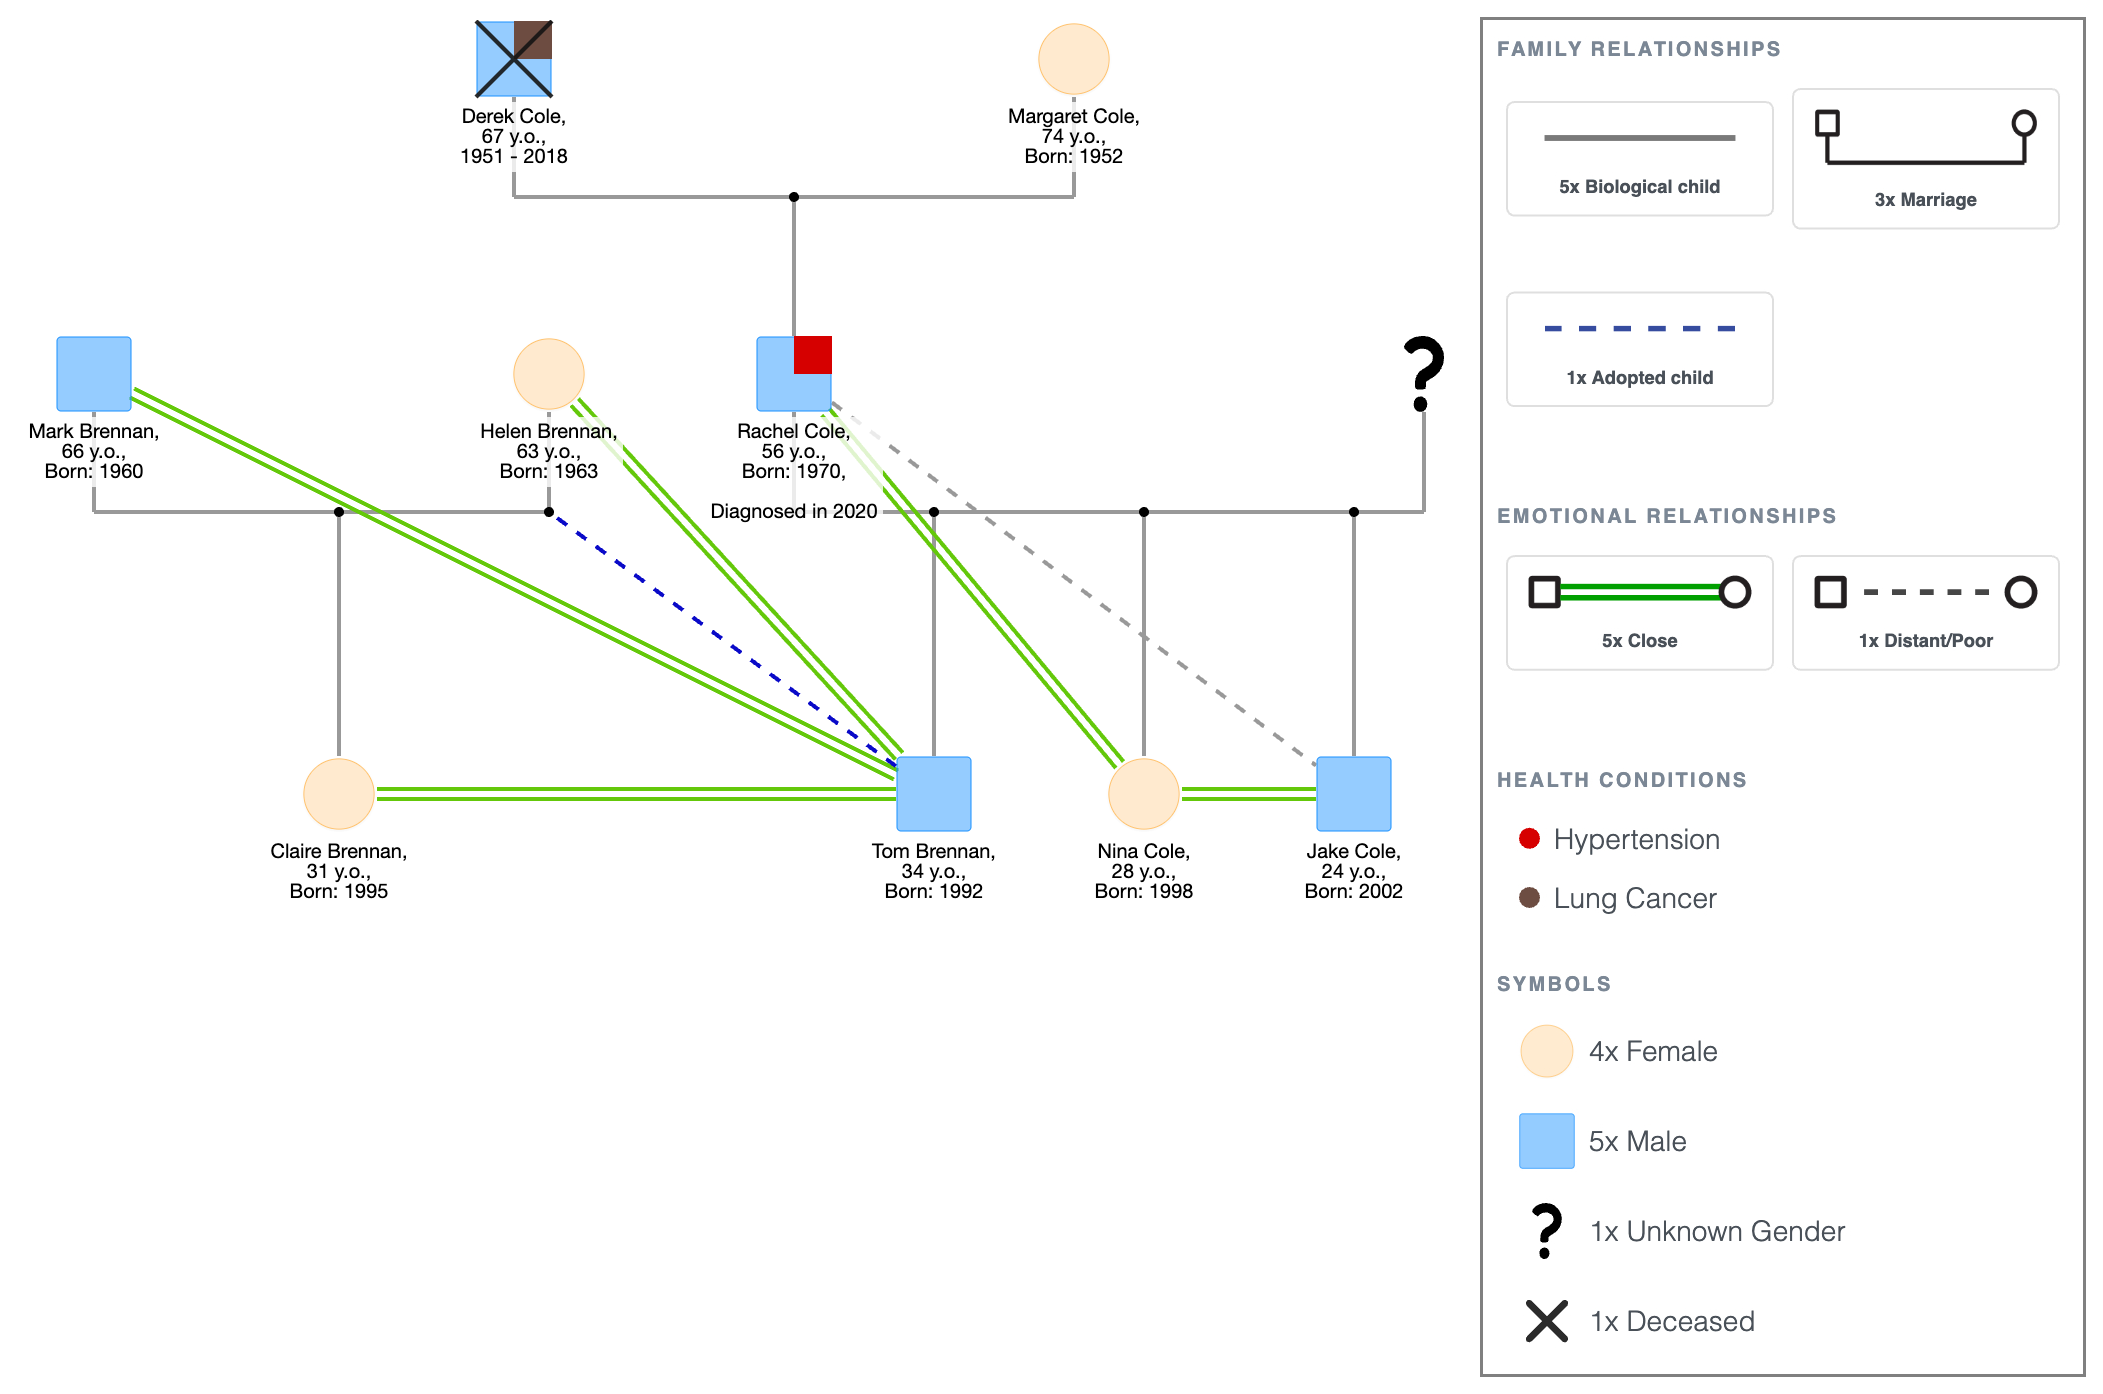
The family:
- Tom Brennan, 34, primary person. Adopted at birth.
- Adoptive family; shown as a separate household unit: Mark Brennan, 66, and Helen Brennan, 63. Close lines between Tom and both adoptive parents. Tom's adoptive sister: Claire Brennan, 31. Close line between Tom and Claire.
- Biological mother: Rachel Cole, 56. Hypertension, diagnosed 2020. Two subsequent children: Nina Cole, 28, and Jake Cole, 24. Close line between Rachel and Nina. Distant line between Rachel and Jake.
- Rachel's parents: Derek Cole (deceased, 2018, lung cancer, age 67) and Margaret Cole, 74.
- Biological father: unknown. Marked on diagram with standard notation.
- Nina and Jake were told about Tom when they were teenagers. Close line between Nina and Jake. No relationship line between Nina and Tom; no relationship line between Jake and Tom; relationships not yet established.
What the genogram showed:
- Derek died in 2018 of lung cancer. He is the second most likely person to have held information about Tom's biological father, or at least the context of Rachel's life in 1990. The genogram showed Tom that the person who might have answered the most important open question had been gone for six years before Tom made contact.
- Rachel's hypertension is noted. Derek's lung cancer is noted. Tom came into the meeting with a partial medical history he did not have before. The biological father's symbol is marked as unknown.
- The close line between Rachel and Nina and the distant line between Rachel and Jake sit in the same generation. Tom can see that his two half-siblings have different relationships with the mother they share. He can also see that Nina and Jake are close to each other. He is walking into a sibling subsystem that already exists and already has its own structure.
- Tom's adoptive family appears on the left side of the diagram with close lines running in both directions. His biological family appears on the right with its own structure, its own health history, and its own relationship lines.
- The genogram holds both families on the same page without flattening the difference between them.
The Adoptee: The Brennan Family Genogram Example
Explore this genogram and adapt it to your needs.
What All Three Have in Common
- None of these situations began in a clinic. The information in each genogram already existed before the diagram was built; Clare had her notes, David had his calendar, Tom had his phone call.
- What made each one a genogram rather than a family tree was what the diagram showed beyond the structure: the conflict line that explained why one branch of Clare's family had almost nothing on record, the relationship lines that showed David's siblings what the care arrangement had actually looked like for eighteen months, the distant line between Rachel and Jake that told Tom something about the family he was walking into before he arrived. A family tree shows who is in the family, while a genogram shows what is happening in it.
How to Build a Genogram
Open any of the examples above in EasyGenogram and adapt it to your own situation, or start from scratch. For a full walkthrough, see how to make a genogram.
- Start with the primary person: mark them with a double border. Build the diagram outward from their position.
- Add the immediate family: parents, siblings, partner, and children in their rows.
- Add one more generation: grandparents where available, or additional branches where relevant.
- Add health notes and life events: conditions, causes of death, significant dates beside the relevant person.
- Add relationship lines: draw the connections that are significant for your purpose. These are what turn a family map into a genogram.
- Export: download as PDF or PNG when done.
FAQ
What are genogram examples used for in real life?
Outside of clinical settings, genograms are used to organize family history for memoir or genealogy work, to show the current state of family relationships and responsibilities in a dispute, and to map an unfamiliar family before a significant first contact. The examples on this page show all three.
Can a genogram be used outside of therapy or medicine?
Yes. The standard symbols and structure work for any situation where you need to map a family clearly. A genogram built for a family dispute about eldercare uses the same symbols as one built for a therapy intake. The purpose changes, but the format stays the same.
What does a genogram show that a family tree doesn't?
A family tree shows lineage; who descended from whom. A genogram shows the current and historical state of the family: who is in contact, who is estranged, who is carrying responsibility, and what health history runs through which branches. Relationship quality, significant life events, and health conditions all sit on the same diagram alongside the structure. A family tree tells you who the family is; a genogram tells you how it functions.
How detailed does a genogram need to be?
It depends on the purpose. It should have at least three generations. Match the detail level to what the diagram is being used for.
Can I download genogram examples as PDF?
Yes. Open any example on this page in EasyGenogram and use the PDF export button.
Sources
- Genograms: Assessment and Intervention (3rd ed.). W.W. Norton & Company.
- Family Therapy in Clinical Practice. Jason Aronson.