Appearance
Example of Genogram
An example of a genogram is any family diagram that uses standard genogram symbols to show structure plus one clear purpose, such as career patterns, migration history, or a current intake snapshot. The three examples on this page show those three use cases directly.
Example 1 - Occupational Genogram: The Price Family
Occupational Genogram Example: The Price Family
The family:
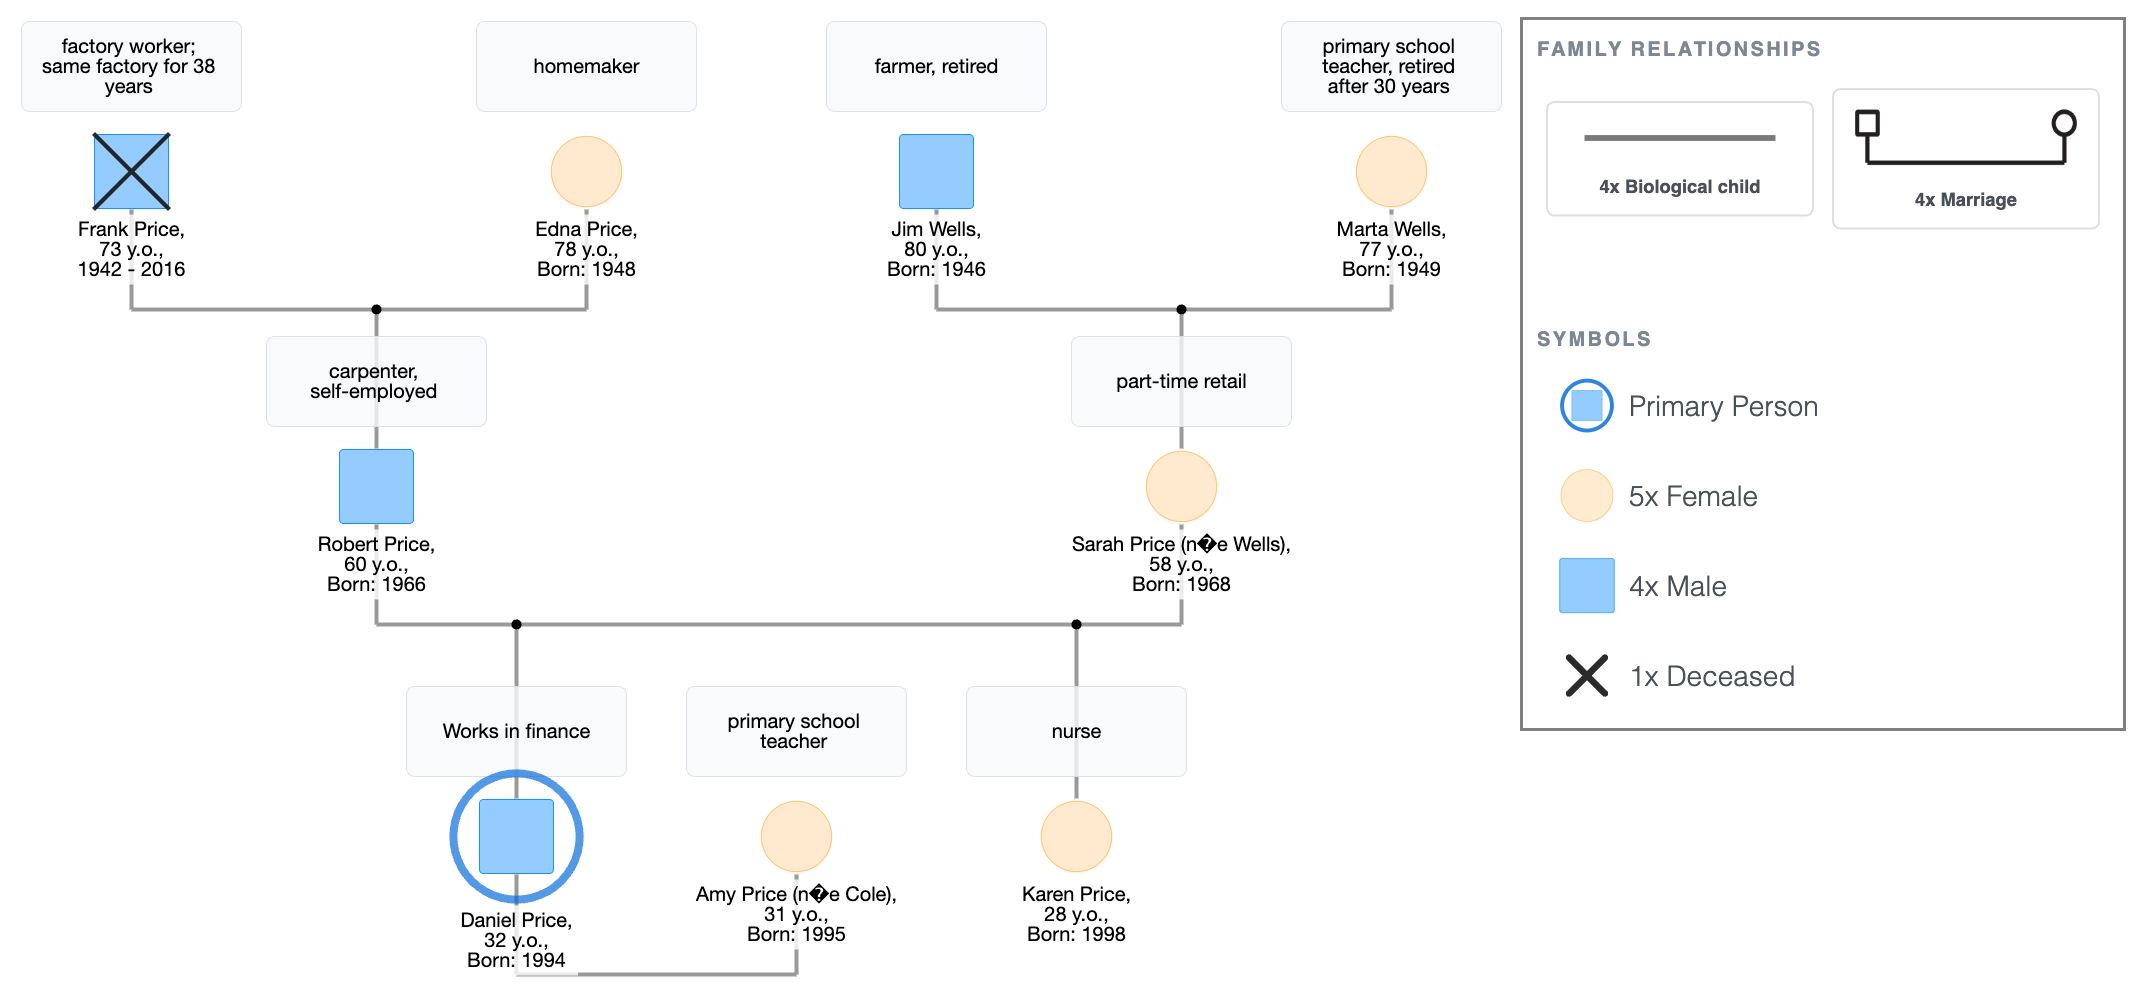
- Daniel Price, 32, is the primary person. He works in finance; the first person on the paternal side to work in a professional office role.
- Daniel's parents: Robert Price, 60 (carpenter, self-employed), and Sarah Price (née Wells), 58 (part-time retail).
- Robert's parents: Frank Price (deceased, age 74, factory worker; same factory for 38 years) and Edna Price, 78 (homemaker).
- Sarah's parents: Jim Wells, 80 (farmer, retired) and Marta Wells, 77 (primary school teacher, retired after 30 years).
- Daniel's sister: Karen Price, 28 (nurse).
- Daniel is married to Amy Price (née Cole), 31 (primary school teacher).
What you can now see:
- The paternal line runs factory → carpenter → finance. Frank worked one job for 38 years. Robert is self-employed in a trade. Daniel works in an office. Three generations with three different relationships to work, and the shift is visible in a single column on the left side of the diagram.
- The maternal line runs farmer and teacher → part-time retail → nurse and teacher. Marta taught for 30 years. Sarah stepped back from full-time work. Karen is in healthcare; Amy is a teacher. The service pattern from the maternal side carried forward.
- Amy is a teacher. Marta is a teacher. They are on opposite sides of the diagram, one generation apart, with no biological connection. An occupational genogram puts that parallel directly in front of you.
- Daniel is the occupational outlier on the paternal side. That fact sits in the structure and belongs to whoever reads it.
Occupational Genogram Example: The Price Family
Explore this genogram and adapt it to your needs.
Example 2 - Migration Genogram: The Stone Family
Migration Genogram Example: The Stone Family
The family:
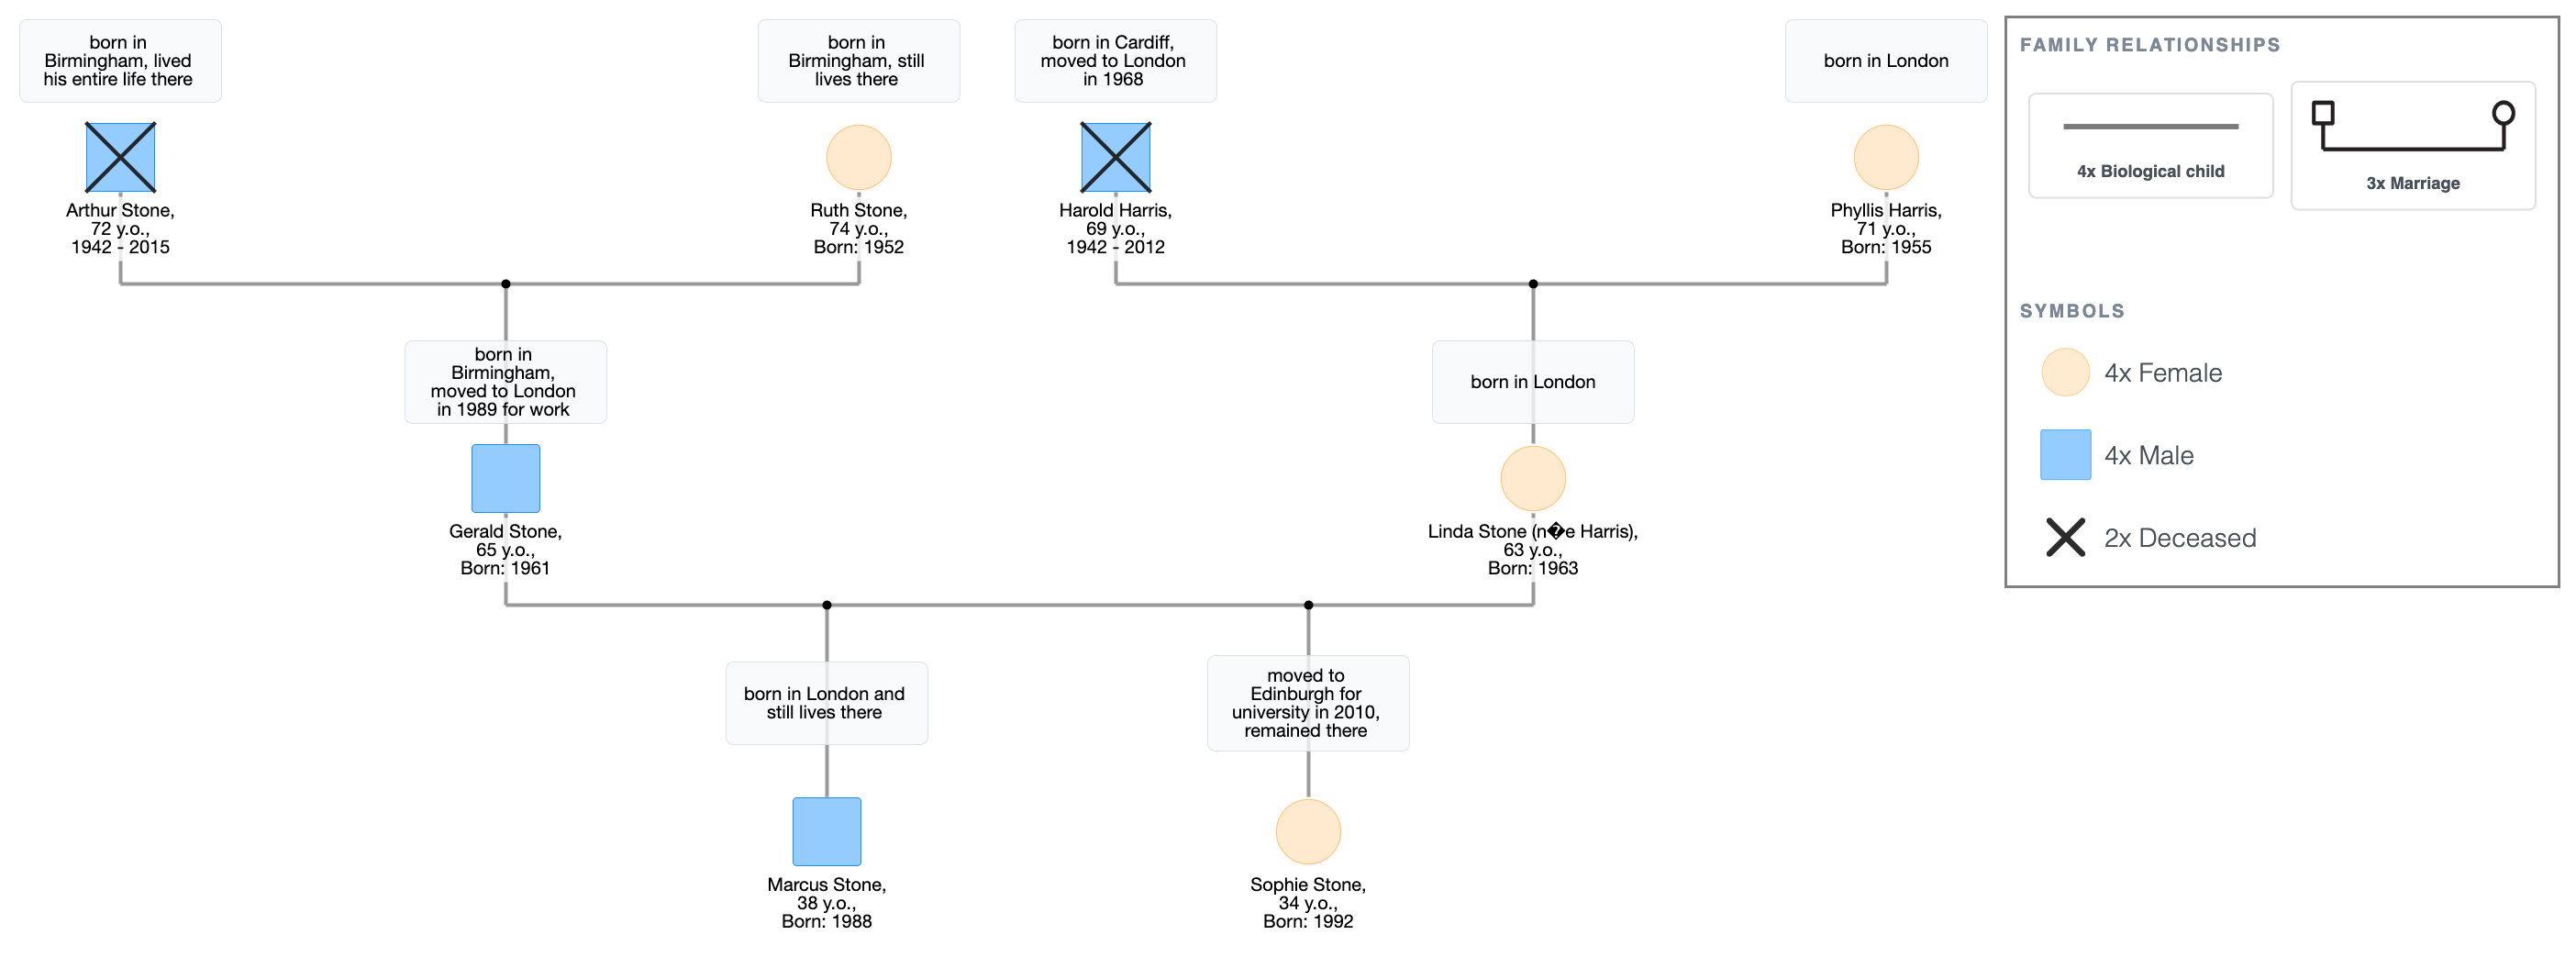
- Marcus Stone, 38, is the primary person. He was born in London and still lives there.
- Marcus's parents: Gerald Stone, 65 (born Birmingham, moved to London in 1989 for work) and Linda Stone (née Harris), 63 (born in London).
- Gerald's parents: Arthur Stone (deceased, 2015, age 73; born in Birmingham, lived his entire life there) and Ruth Stone, 74 (born in Birmingham, still lives there).
- Linda's parents: Harold Harris (deceased, 2012, age 70; born in Cardiff, moved to London in 1968) and Phyllis Harris, 71 (born in London).
- Marcus's sister: Sophie Stone, 34 (moved to Edinburgh for university in 2010, remained there).
- Geographic notes marked on each person's symbol: Birmingham, London, Cardiff, Edinburgh.
What you can now see:
- Arthur's symbol is the only one with no movement marker. He was born in Birmingham and died in Birmingham. Gerald moved; Marcus was born in the destination city. Three generations, and the migration is already absorbed; by Marcus's generation, London is simply home.
- Harold moved from Cardiff to London in 1968. Gerald moved from Birmingham to London in 1989. Two separate migration events with two separate family lines, twenty-one years apart, both landing in the same city.
- Sophie moved to Edinburgh. The Stone family had been moving toward London for two generations; Sophie is the first to move away from it. On the migration genogram, that reversal sits clearly in the third generation, on the right side of the sibship line.
- Ruth is still in Birmingham. She is the only living person in the diagram who never moved. That makes her structurally isolated from every other living family member.
Migration Genogram Example: The Stone Family
Explore this genogram and adapt it to your needs.
Example 3 - Intake Snapshot Genogram: The Quinn Family
Intake Snapshot Genogram: The Quinn Family
The family:
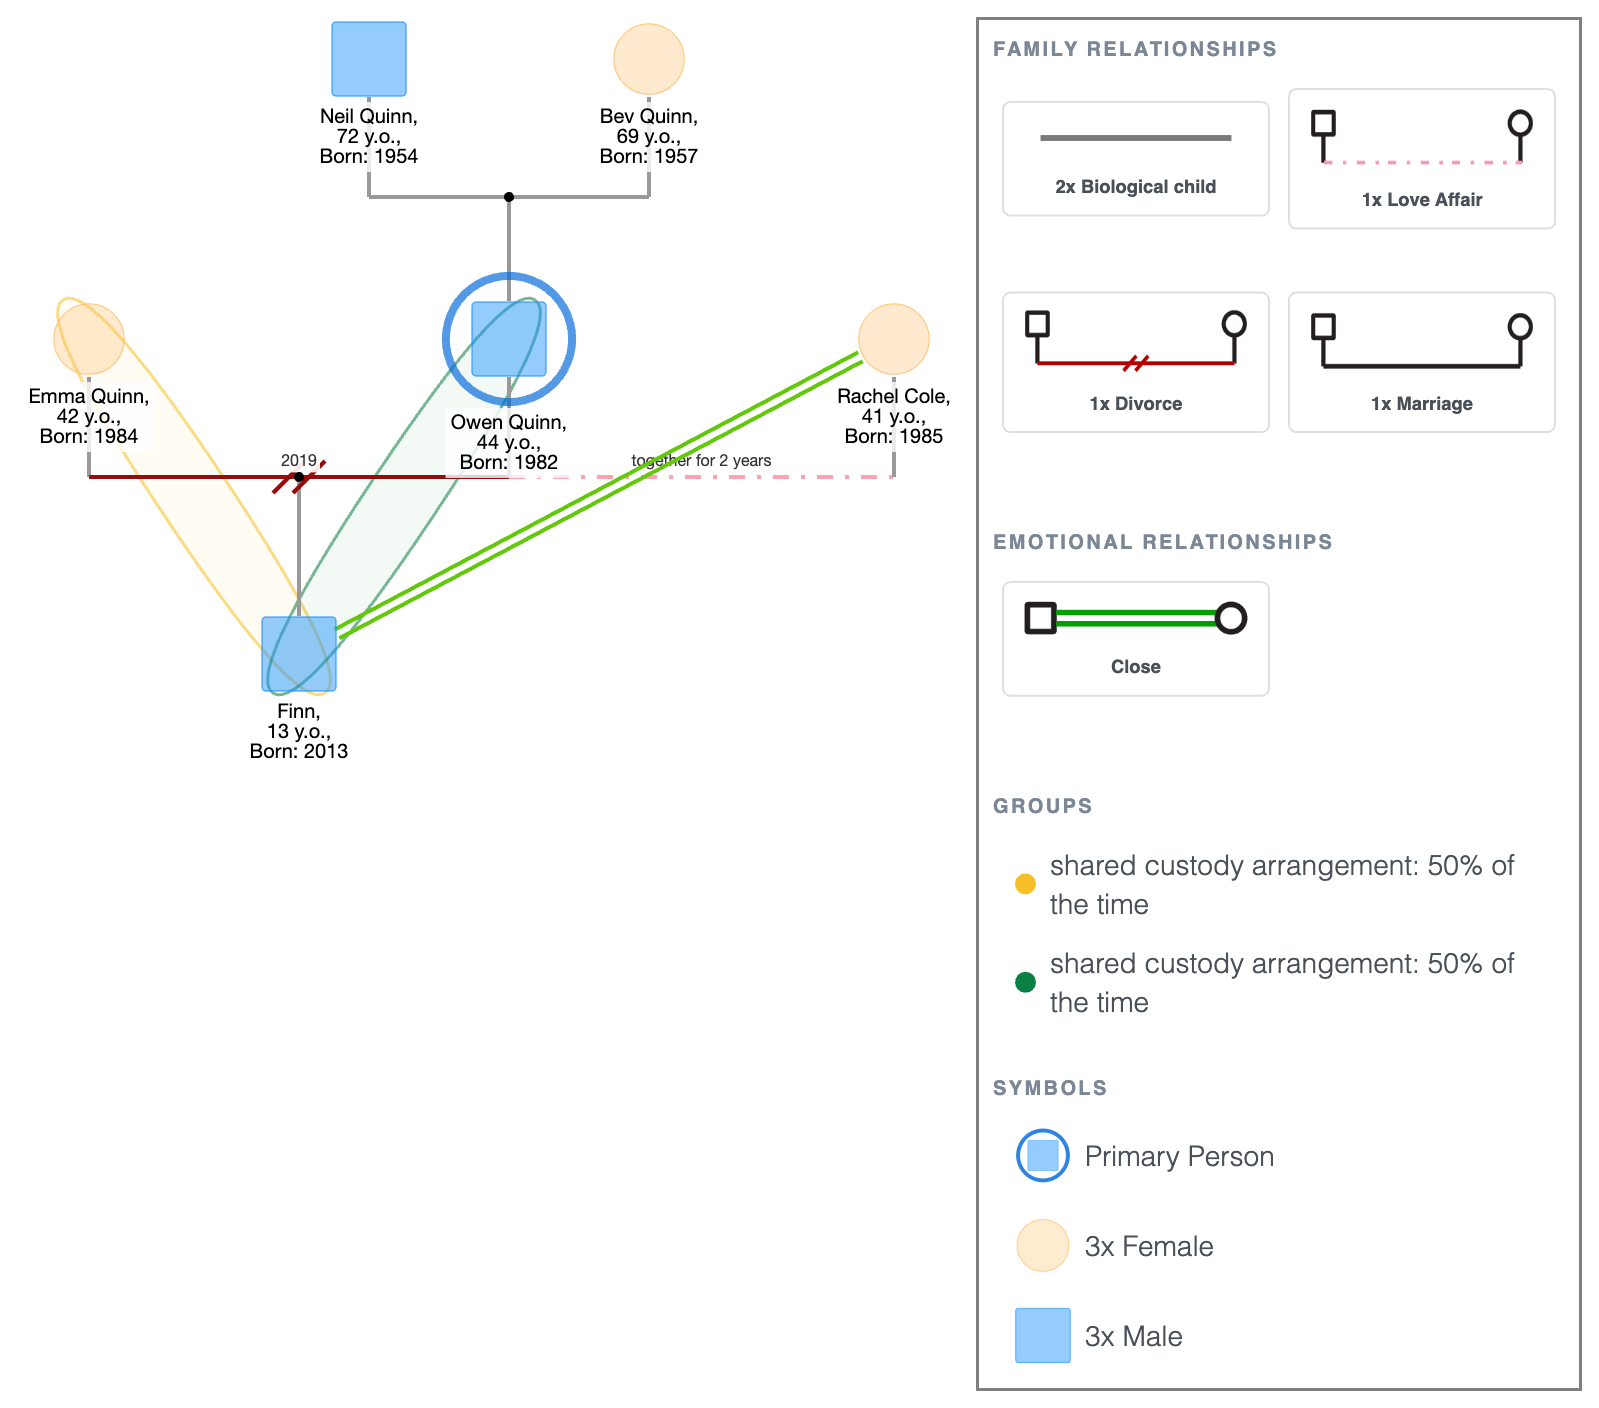
- Owen Quinn, 44, is the primary person. He is attending his first therapy session.
- Current household: Owen and his partner Rachel Cole, 41 (not married, together two years). Owen's son Finn, 13, lives with Owen 50% of the time under a shared custody arrangement.
- Finn's mother: Emma Quinn (divorced from Owen, 2019), 42. Finn lives with Emma the other 50% of the time.
- Owen's parents: Neil Quinn, 72, and Bev Quinn, 69. Both local and frequent contact with Owen.
- Rachel has no children. Close line to Finn noted on diagram.
- Current notes on diagram: shared custody arrangement since 2019; Owen's parents aging, increasing support needed; Rachel and Owen are together but not cohabiting.
What you can now see:
- The intake snapshot genogram is more about the present. Owen's symbol sits at the center of a diagram that shows who he is currently in contact with, who he is responsible for, and where the pressure points are, all before a therapist has asked a single question.
- The custody line between Owen and Emma is drawn with the year. Finn appears below both of them, connected to each. His position on the diagram between two households, two parents, and one partner who is close to him is also visible in the structure.
- Neil and Bev appear in the grandparent row.
- Rachel has a close line to Finn. She and Owen are not cohabiting, but she is present in Finn's life but structurally outside the household.
Intake Snapshot Genogram: The Quinn Family
Explore this genogram and adapt it to your needs.
What a Genogram Legend Includes
Every genogram should include a key listing what each symbol and line type means.
A legend for the examples on this page includes: squares (males), circles (females), an X for deceased, a double border for the primary person, line types for marriage and partnership, a divorce slash, parent-child and sibling lines, and any relationship lines used (close, conflict, cutoff).
For a full reference of standard genogram symbols, see the genogram symbols guide.
When to Use Each Type
- Occupational genogram: when career patterns, work roles, or socioeconomic mobility across generations are relevant to the assessment or the person's presenting concern.
- Migration genogram: when geographic history shapes the family's current structure, cultural identity, or access to support.
- Intake snapshot: when the goal is to establish who is currently in someone's life at the start of a clinical engagement, not to document history.
How to Build a Genogram
Open any of the examples above in EasyGenogram and adapt it to your family, or start from scratch. For a full walkthrough, see how to make a genogram.
- Decide what you are mapping: the purpose determines what goes on the diagram. An occupational genogram needs occupation labels; a migration genogram needs location markers; an intake snapshot needs current contact notes.
- Place the primary person: mark them with a double border and build the diagram outward from them.
- Add the relevant generation: for most purposes, three generations is enough. Add more only if the information is available and useful.
- Add your custom layer: occupations, locations, or current status notes beside each relevant person.
- Add relationship lines where they matter: even a migration or occupational genogram benefits from one or two key relationship lines.
- Add the key: list every symbol and annotation type used on the diagram.
- Export: download as PDF or PNG when done.
FAQ
What is an example of a genogram?
A genogram is a diagram that maps a family using standardized symbols; squares for males, circles for females, lines for relationships and connections. The three examples on this page show what a genogram looks like when built for different purposes: tracking occupational patterns, documenting migration, and capturing a family's current situation at the start of a clinical engagement.
What does a genogram key include?
A genogram key or legend lists every symbol and line type used on the diagram and what each one means. At minimum: shapes for male and female, a marker for deceased members, a primary person indicator, and the line types used for relationships.
Can a genogram show more than family relationships?
Yes. A genogram can map any information that is meaningfully connected to the family structure, such as occupational history, geographic movement, current household composition, health history, or emotional relationship quality. The standard symbols stay the same; the annotation layer changes depending on what you are trying to document.
What is a genogram used for?
Genograms are used in therapy and counseling to map a client's family system, in medicine to document hereditary health history, in social work for family assessments, and in academic coursework across psychology, nursing, and social work programs. They are also used for personal documentation; mapping a family's history and structure before the people who remember it are no longer around.
Can I download a genogram example as a PDF?
Yes. Open any of the examples on this page in EasyGenogram and use the PDF export button. Students with a valid school email can export free.
Sources
- Genograms: Assessment and Intervention (3rd ed.). W.W. Norton & Company.
- Family Therapy in Clinical Practice. Jason Aronson.