Appearance
Detailed Genogram Example
A detailed genogram adds the annotation a basic genogram leaves out: diagnosis dates, death years, relationship lines for significant connections, and life events in sequence. The goal is that someone can read the diagram without follow-up explanation and still understand the family clearly.
Example 1 - Detailed Medical Genogram: The Sutton Family
Detailed Medical Genogram: The Sutton Family Genogram Example
The family:
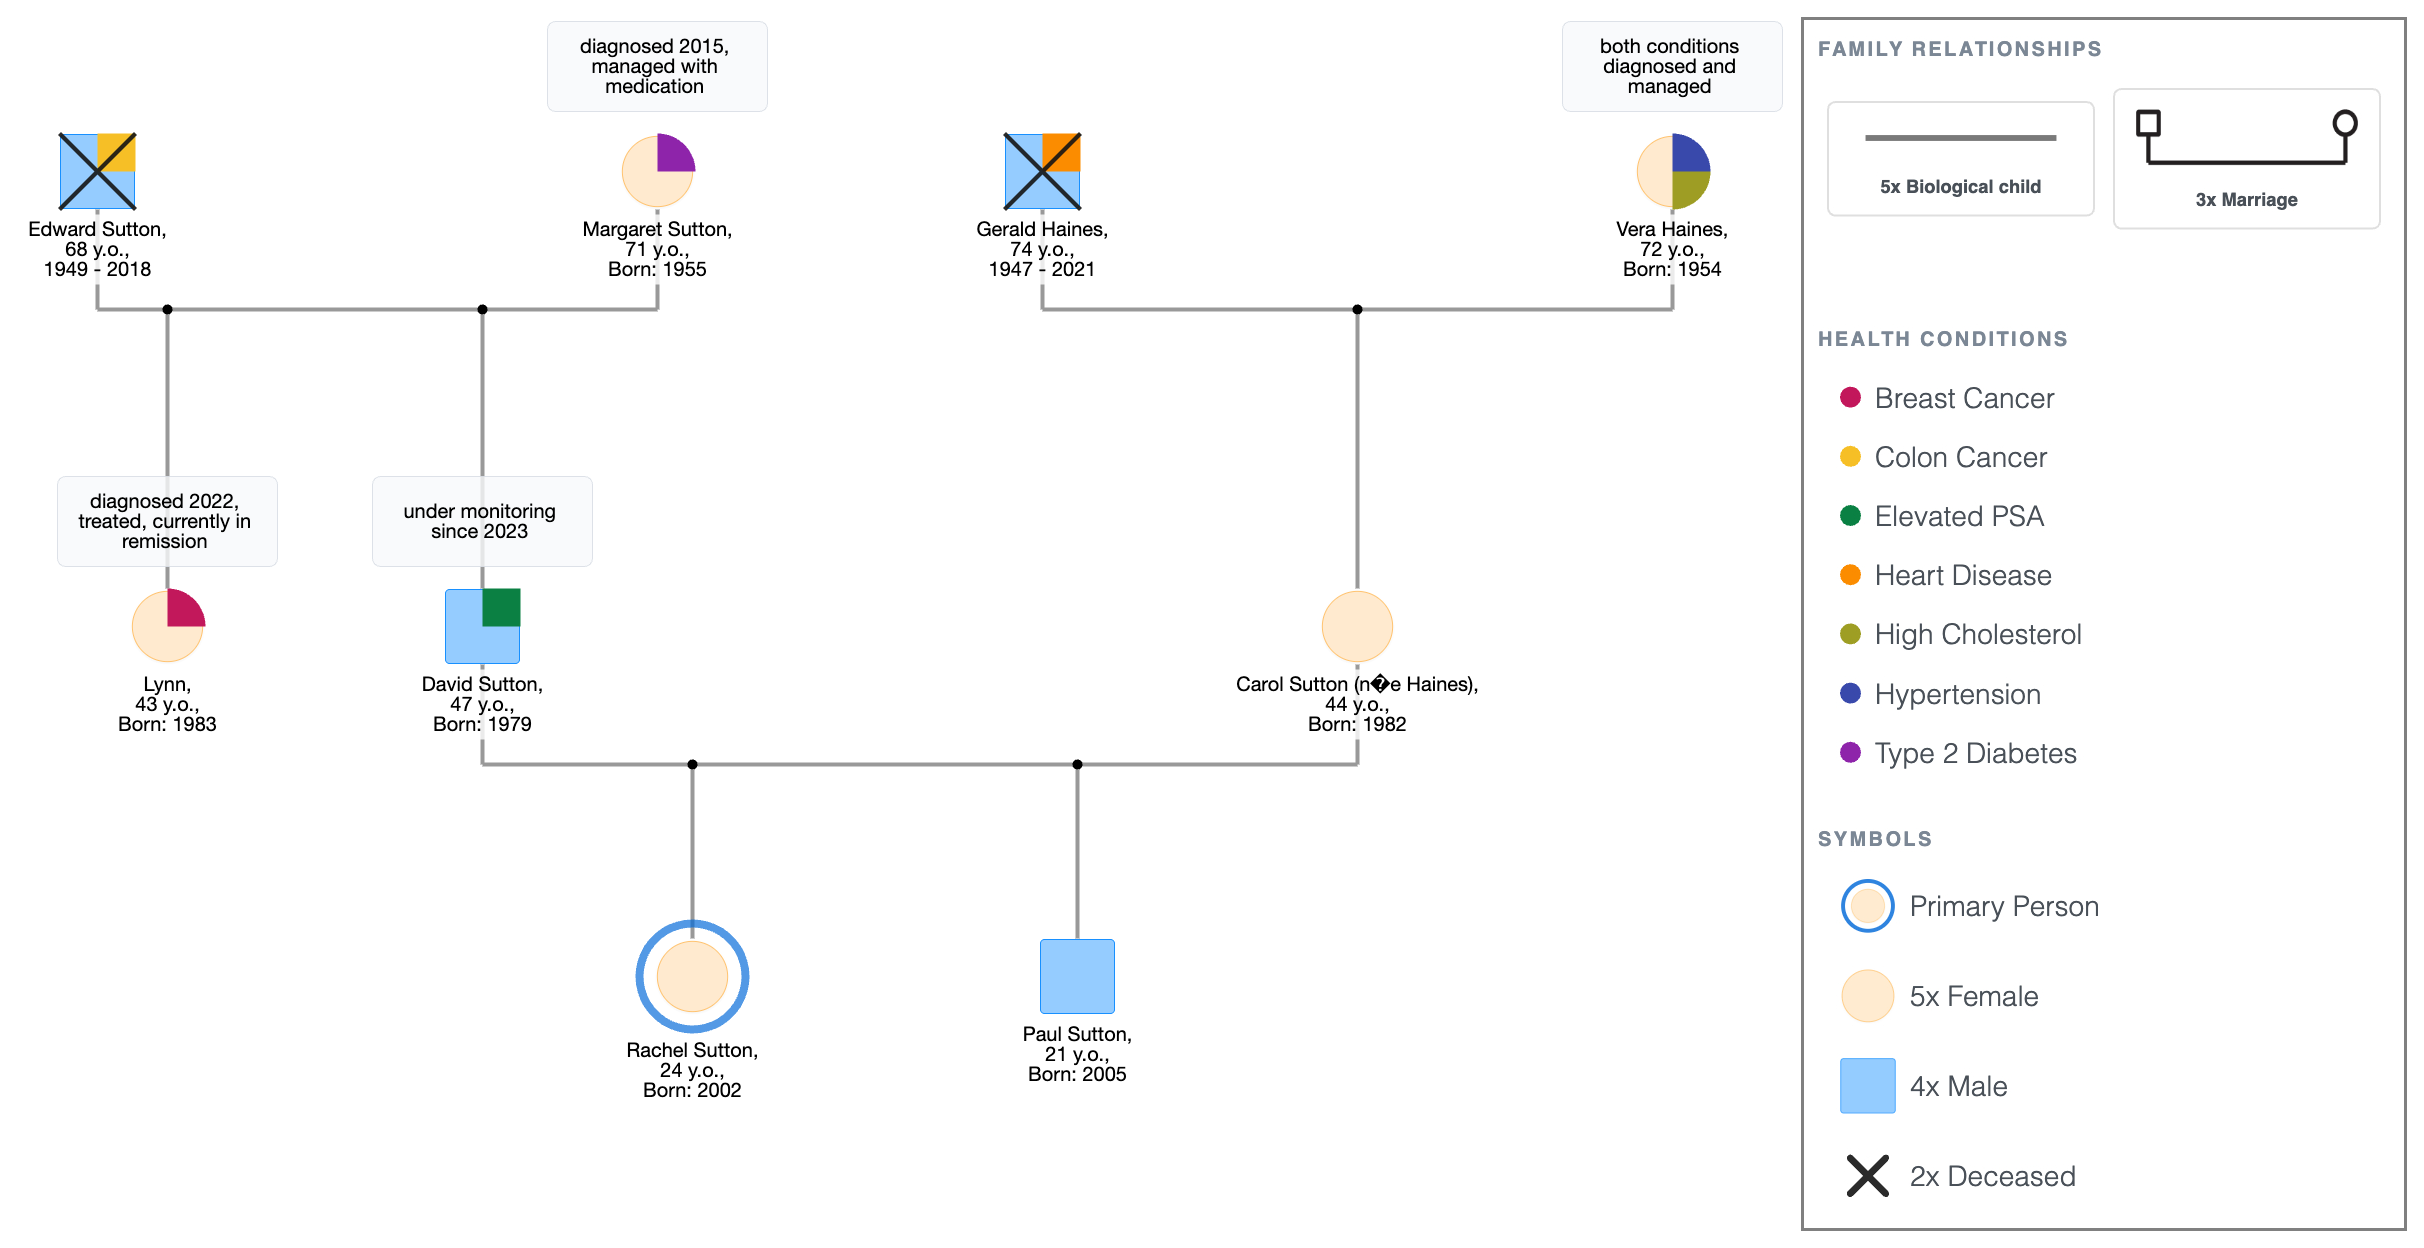
- Rachel Sutton, 24, is the primary person. She is attending a GP appointment for a family history review. She is currently healthy with no diagnosed conditions.
- Rachel's parents: David Sutton, 47 (elevated PSA, under monitoring since 2023) and Carol Sutton (née Haines), 44.
- Rachel has one sibling: Paul Sutton, 21.
- Paternal grandparents: Edward Sutton (deceased, 2018, colon cancer, age 69) and Margaret Sutton, 71 (type 2 diabetes, diagnosed 2015, managed with medication).
- David has one sibling: his sister Lynn, 43 (breast cancer, diagnosed 2022, treated, currently in remission).
- Maternal grandparents: Gerald Haines (deceased, 2021, heart disease, age 74) and Vera Haines, 72 (hypertension, high cholesterol, both diagnosed and managed).
What you can now see:
- Edward's colon cancer sits in the top-left corner of the diagram. David's elevated PSA sits one row below it, on the same side. Two generations of the same family line and a related system. Edward's diagnosis became fatal at 68; David is 47 and already under monitoring. The genogram puts those two facts in the same visual column.
- Lynn's breast cancer appears beside David on the paternal row. Colon cancer, breast cancer, and elevated PSA all appear on the paternal side within two generations.
- On the maternal side: heart disease in Gerald, hypertension and high cholesterol in Vera.
- Rachel, 24, sits at the bottom of all of this. She is the reason the genogram was built (the primary person). Her symbol is empty, no conditions noted, but the diagram shows a GP exactly what to track and when to start.
- Margaret's diabetes and Vera's hypertension appear in the grandparent row on separate sides. Both are metabolic, currently managed and are relevant to Rachel and Paul in twenty years. They are on the diagram now.
Detailed Medical Genogram: The Sutton Family Genogram Example
Explore this genogram and adapt it to your needs.
Example 2 - Detailed Therapeutic Genogram: The Vance Family
Detailed Therapeutic Genogram: The Vance Family Genogram Example
The family:
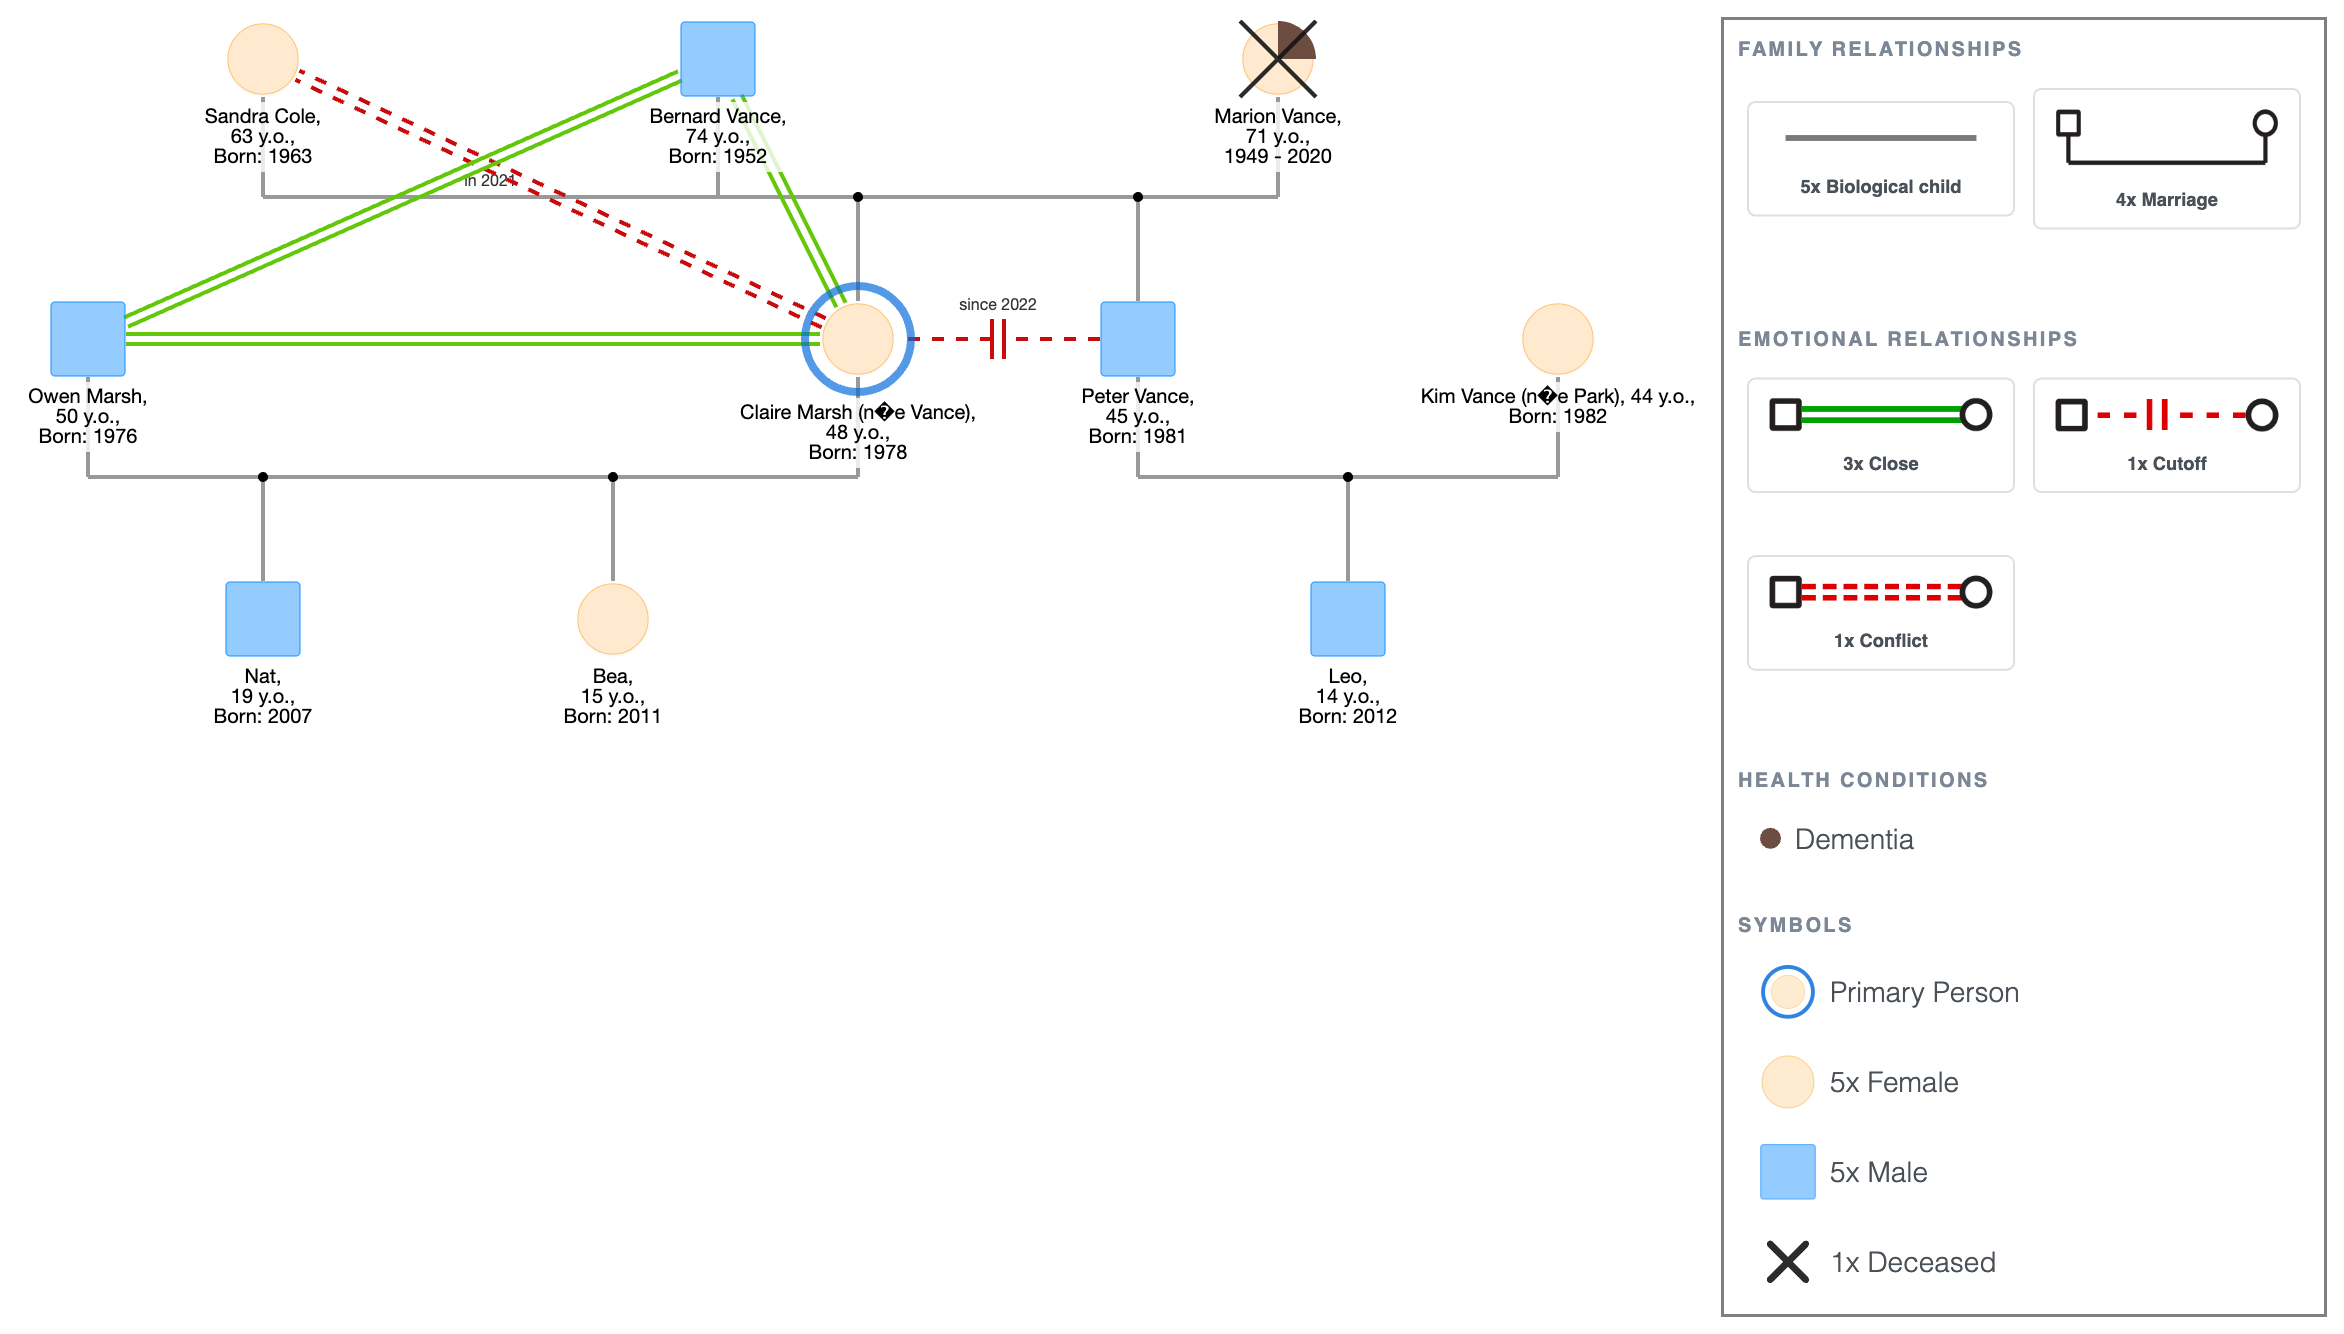
- Claire Marsh (née Vance), 48, is the primary person. She is beginning therapy following increasing family tension since her father's remarriage.
- Claire is married to Owen Marsh, 50. They have two children: Nat, 19, and Bea, 15. Close line between Claire and Owen.
- Claire's father: Bernard Vance, 74. Close line between Bernard and Claire. Bernard's first wife (Claire’s mother), Marion Vance (deceased, 2020, dementia, age 71). Bernard remarried Sandra Cole, 63, in 2021.
- Claire's brother: Peter Vance, 45. Cutoff from Claire since 2022. Conflict line with Sandra. Married to Kim Vance (née Park), 43. Their child: Leo, 14.
- Owen and Bernard: close line.
- Life events noted with dates: Marion's death, 2020. Bernard and Sandra's marriage, 2021. Peter and Claire's estrangement, 2022.
What you can now see:
- Marion's death (2020), Bernard's remarriage (2021), and Peter's estrangement from Claire (2022) are three events on the same diagram with three consecutive dates. Without the dates they look like separate, unrelated facts. With them, the sequence is visible: each event followed the previous one within a year. A therapist reading this genogram before the first session already knows the order things happened in.
- Claire's close line to Bernard and her cutoff line to Peter appear side by side. She maintained one relationship in the family and lost another at the same time, with the same event as the trigger.
- Owen's close line to Bernard is drawn between a son-in-law and a widowed father-in-law who has since remarried. That relationship runs alongside Claire's close line to her father and Claire's cutoff line to her brother. The three lines together describe a family subsystem that a verbal summary would take several minutes to explain.
- Nat, Bea and Leo are first cousins with no relationship line between them. The absence of that line is the annotation; they don't have a relationship because their parents stopped speaking when Leo was 11. The diagram shows what the estrangement cost the next generation without stating it.
Detailed Therapeutic Genogram: The Vance Family Genogram Example
Explore this genogram and adapt it to your needs.
What Makes a Genogram "Detailed"
A detailed genogram is not just a bigger diagram. The difference is annotation depth:
- Every person has a name, age, and any relevant health condition or life event noted beside their symbol.
- Health conditions include diagnosis year and current status where known, not just the condition name.
- Life events have dates; deaths, marriages, divorces, estrangements, diagnoses.
- Relationship lines are drawn for every significant connection, not just the ones that are easy to map.
- The diagram can be read by someone who has never met the family and still get an accurate picture.
A basic genogram establishes who is in the family. A detailed genogram documents what is happening in it. For a reference on what symbols carry the annotation, see the genogram symbols guide.
When You Need This Level of Detail
- Medical referrals and genetic counseling: a GP, specialist, or genetic counselor needs complete multi-generational health history, not just any type of summary.
- Therapy intake: a therapist building a picture of the family system before sessions begin needs relationship lines and life event sequences.
- Academic assignments requiring full annotation: most advanced coursework in social work, nursing, and psychology specifies annotated genograms.
- When a partial genogram has created confusion: if an earlier, less complete genogram missed something significant, a detailed rebuild clarifies it.
When Less Detail Is Better
Adding detail to a genogram that doesn't need it makes it harder to read, not more complete. If the goal is to establish household structure quickly, start with the basic genogram example. If the family has multiple overlapping types of complexity, see the complex genogram example.
How to Build a Detailed Genogram
Open either example above in EasyGenogram and replace the details with your own, or start from scratch. For a full walkthrough, see how to make a genogram.
- Build the structure first: place all family members, marriages, and sibling lines before adding any annotation. A cluttered structure is harder to annotate accurately.
- Add health conditions and dates: go through each person and note any conditions, diagnoses, and causes of death. Include the year wherever you have it.
- Add life events in sequence: note significant events with dates: deaths, divorces, remarriages, estrangements. The sequence matters as much as the events.
- Add relationship lines: map every significant relationship with the appropriate line type. In a detailed genogram, this means more than one or two lines.
- Check the legend: a detailed genogram uses more symbol types than a basic one. Make sure the legend accounts for every line and marker on the diagram.
- Export: download as PDF or PNG when done.
FAQ
What is a detailed genogram?
A detailed genogram is a fully annotated family diagram that documents health conditions with dates and status, life events in sequence, and relationship quality for every significant connection in the family. It goes beyond the structural skeleton to give a complete picture of the family system; one that can be read and understood without additional verbal explanation.
What should a detailed genogram include?
Names, ages, and relationships across at least three generations; health conditions with diagnosis years and current status; causes of death with ages; significant life events with dates; relationship lines for every notable connection; and a key. A detailed genogram should be complete enough that a clinician or supervisor can read it cold and understand the family.
How is a detailed genogram different from a basic one?
A basic genogram shows structure and one or two health notes. A detailed genogram adds annotation depth like conditions with dates, life events in sequence, and a full relationship map. The symbols are the same; the difference is in how much information each symbol and line carries.
What does a detailed genogram example with explanation look like?
The Sutton and Vance family examples on this page are both detailed genograms with explanations. The Sutton family shows how medical history is documented across generations for a clinical referral. The Vance family shows how relationship lines and dated life events are used in a therapeutic context. Both include a section walking through what the completed diagram reveals.
How do you annotate a genogram?
Annotations sit beside each person's symbol; typically below or to the right. Health conditions are noted with the condition name and diagnosis year. Causes of death appear below a deceased person's symbol alongside their age at death. Significant life events are noted with a date beside the relevant person or couple. Relationship lines carry the annotation through their line type rather than text labels on the lines themselves.
Sources
- Genograms: Assessment and Intervention (3rd ed.). W.W. Norton & Company.
- Family Therapy in Clinical Practice. Jason Aronson.