Appearance
Complex Genogram Example
A complex genogram is used when a basic three-generation diagram is no longer enough to hold the family clearly. It keeps multiple layers on one page, such as four generations, blended structure, health history, conflict, cutoffs, and close bonds, without flattening them into a simple family tree.
Example 1 – Structural Complexity: The Bishop Family
Structural Complexity: The Bishop Family Genogram Example
The family:
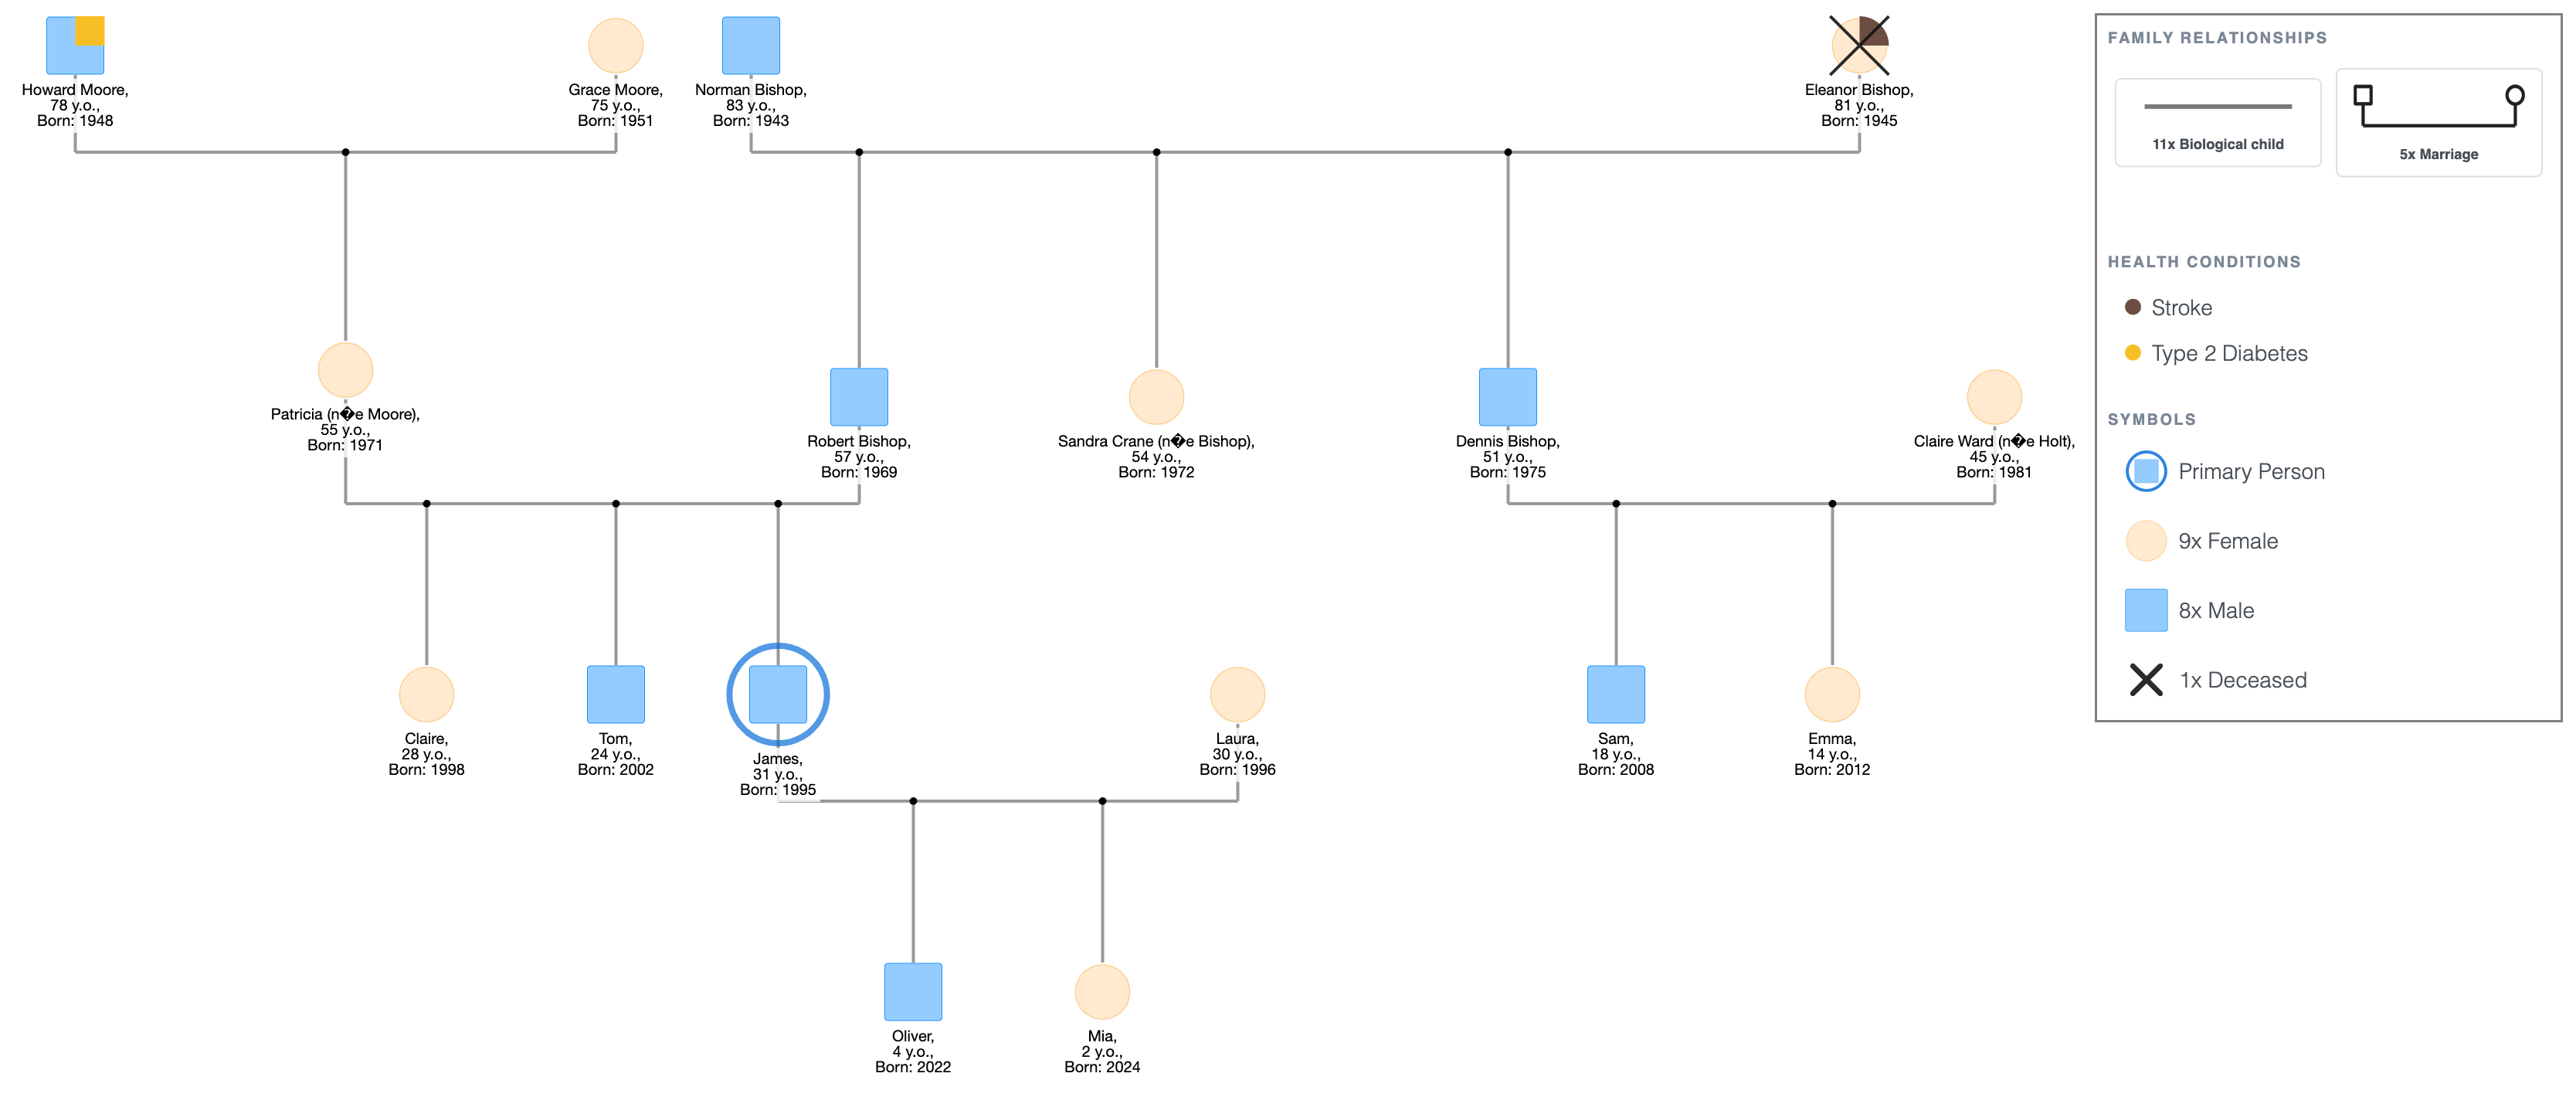
- Norman Bishop, 83, and his wife Eleanor Bishop (deceased, stroke, age 81) are the oldest generation.
- Their three children: Robert Bishop, 57; Sandra Bishop (now Crane), 54; and Dennis Bishop, 51.
- Robert married Patricia (née Moore), 55. They have three children: James, 31 (primary person); Claire, 28; and Tom, 24.
- James is married to Laura, 30. They have two children: Oliver, 4, and Mia, 2.
- Patricia's parents: Howard Moore, 78 (type 2 diabetes) and Grace Moore, 75.
What you can now see:
- The diagram spans four levels. Norman and Eleanor sit at the top; Oliver and Mia, born 2022 and 2024, sit at the bottom. They share a great-grandparent row with people they may never have known.
- Norman is the last person standing in Generation 1. Eleanor's X is the only one in that row. At 83, Norman is no longer part of a pair; he's a single shape connected downward to three adult children. The genogram shows that structural fact without commentary.
- Robert, Sandra, and Dennis are all present in Generation 2, but only Robert's branch goes four levels deep. Sandra and Dennis are there, their families exist, but they're not expanded. Here, everything follows James, the primary person.
Structural Complexity: The Bishop Family Genogram Example
Explore this genogram and adapt it to your needs.
Example 2 – Relational Complexity: The Graham Family
Relational Complexity: The Graham Family Genogram Example
The family:
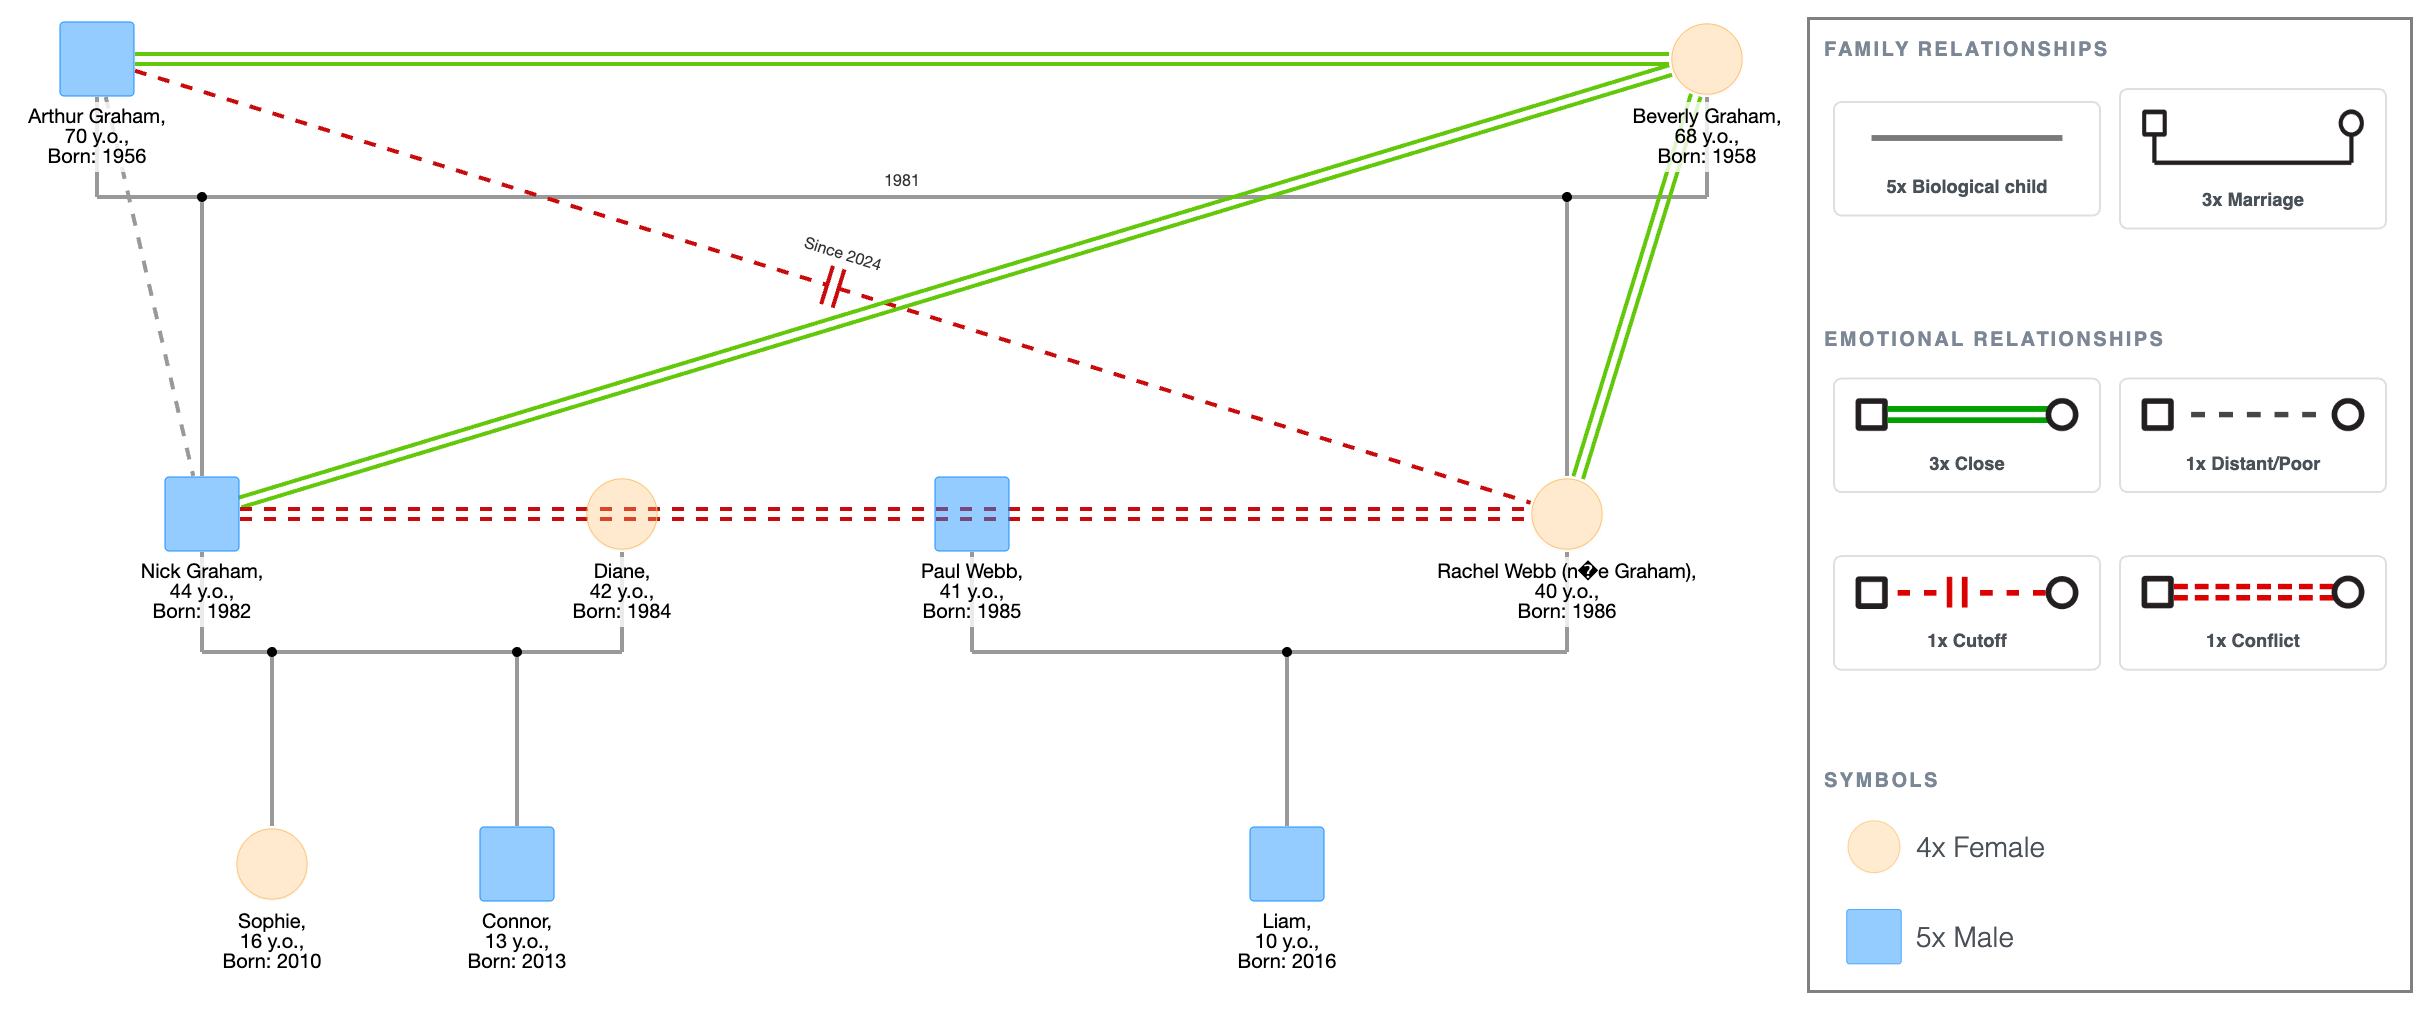
- Arthur Graham, 70, and his wife Beverly Graham, 68, have been married for 45 years. Close relationship line between them.
- Their two children: Nick Graham, 44, and his sister Rachel Webb (née Graham), 40.
- Nick is married to Diane, 42. They have two children: Sophie, 16, and Connor, 13.
- Rachel is married to Paul Webb, 41. They have one child: Liam, 10.
- Other relationship lines: Arthur and Nick - distant; Arthur and Rachel - cutoff (two years); Beverly and Nick - close; Beverly and Rachel - close; Nick and Rachel - conflict.
What you can now see:
- Arthur and Beverly are on the same horizontal line, the same couple, the same marriage. But their relationship lines to their children are completely different. Arthur has a distant line to Nick and a cutoff to Rachel. Beverly has close lines to both. Two people in one marriage, documented differently by the genogram.
- Nick and Rachel's conflict line sits between the parental generation and the children. It doesn't appear at the top or the bottom; it appears exactly where the family divides. Sophie, Connor, and Liam are below it.
- Beverly's two close lines; one to Nick, one to Rachel, make her the structural connector in a family that would otherwise split. The genogram shows what she is doing in the system without naming it.
- Arthur's cutoff with Rachel is recent. His distant line to Nick is not. The cutoff is new; the distance was already there. Both appear on the same diagram at the same visual weight, but the dates tell a different story.
Relational Complexity: The Graham Family Genogram Example
Explore this genogram and adapt it to your needs.
Example 3 – Layered Complexity: The Fleming Family
Layered Complexity: The Fleming Family Genogram Example
The family:
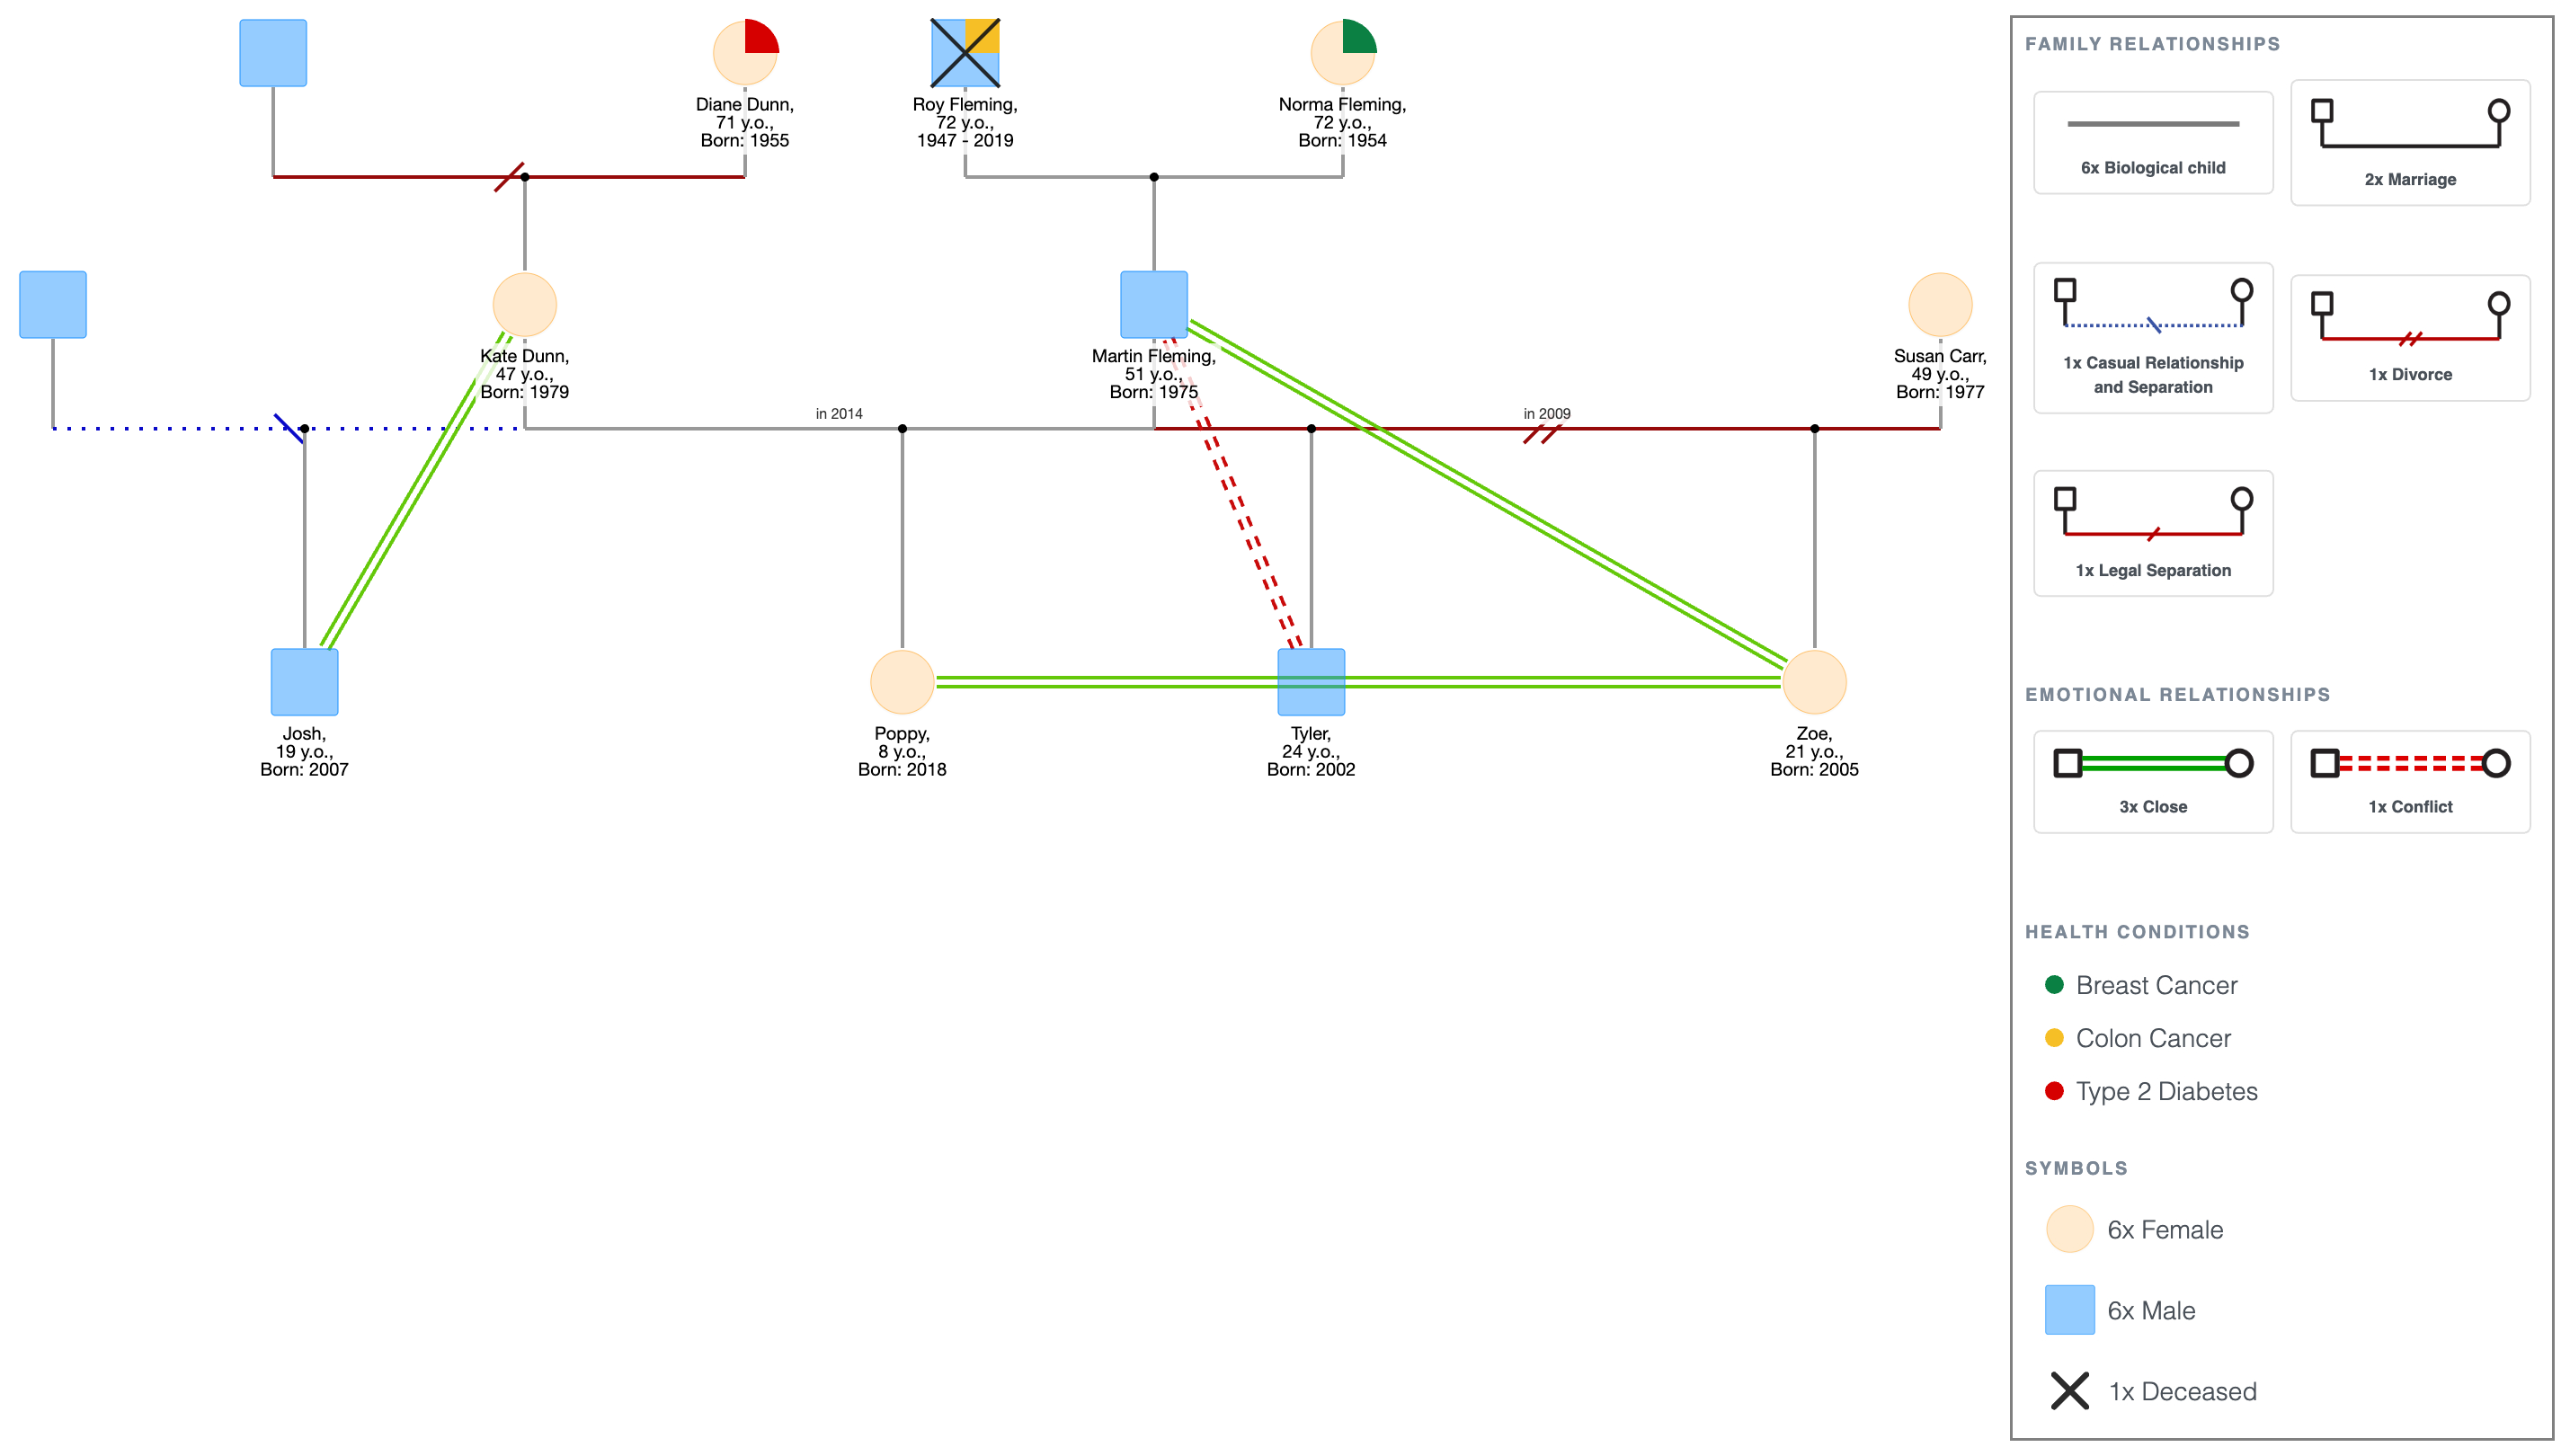
- Martin Fleming, 51, divorced Susan Carr, 49, in 2009. They have two children: Tyler, 24, and Zoe, 21.
- Martin married Kate Dunn, 47, in 2014. Kate has one child from a previous relationship: Josh, 19 (father not involved). Martin and Kate have one child together: Poppy, 8.
- Martin's parents: Roy Fleming (deceased, 2019, colon cancer, age 72) and Norma Fleming, 74 (breast cancer, treated).
- Kate's mother: Diane Dunn, 71 (type 2 diabetes). Kate's father: documented estrangement, not in contact.
- Relationship lines: Martin and Tyler - conflict; Martin and Zoe - close; Kate and Josh - close; Zoe and Poppy - close.
What you can now see:
- Roy's colon cancer and Norma's breast cancer sit in the top-left corner. Two different cancers, same generation, same row. Roy is gone; Norma is 74, treated but alive.
- The divorced line between Martin and Susan, followed by the marriage line to Kate, tells the structural story of the remarriage in two lines. Tyler and Zoe drop below the first. Josh and Poppy appear below the second. Four children, two marriages.
- Tyler's conflict line with Martin and the absence of any line between Tyler and Poppy appear in the same diagram. Tyler, 24, has not accepted the remarriage and has not formed a relationship with his eight-year-old half-sister. The genogram shows those two facts together without stating the connection.
- Kate's father's estrangement sits on the right side of the diagram with no line running from it. That absence is documented, not unknown. A complex genogram distinguishes between information that is missing and a relationship that has been cut off.
Layered Complexity: The Fleming Family Genogram Example
Explore this genogram and adapt it to your needs.
What Makes a Genogram Complex
Complexity in a genogram comes from three sources, and they don't always appear together:
- Structural complexity: more generations with siblings and more branches. The diagram gets wider and taller. The Bishop family shows this.
- Relational complexity: multiple relationship types coexisting in the same family system. Close bonds, conflict, distance, and cutoffs sitting in the same diagram at once. The Graham family shows this.
- Layered complexity: health history, blended structure, and relationship dynamics all present simultaneously. Real families rarely specialize. The Fleming family shows this.
A genogram becomes necessary at this level of complexity when the information matters and a written description can no longer hold it clearly. If you can say it in a sentence, you don't need the diagram. If you need to say it in a paragraph and a reader still can't see it, you do.
When Simpler Is Better
Not every family needs a complex genogram. Adding layers to a diagram that doesn't require them makes it harder to read, not more useful.
- If the goal is to show basic family structure, start with the basic genogram example.
- If two generations and a few relationship lines is enough, see the simple genogram example.
- If the family is blended but not otherwise layered, the blended family genogram example covers that specifically.
How to Build a Complex Genogram
Open any of the examples above in EasyGenogram and adapt it, or start from scratch. For a full walkthrough, see how to make a genogram.
- Build the structure first: place all family members before adding any other layer. Get the generations, marriages, and sibling lines right before anything else.
- Add a generation at a time: don't try to place all four generations at once. Start with the primary person, add parents and siblings, then grandparents, then children if needed.
- Add health notes and life events next: once the structure is stable, note conditions and dates beside relevant members.
- Add relationship lines last: draw emotional connections after everything else is in place. Complex diagrams get unreadable quickly when relationship lines are added too early.
- Keep the legend visible: a complex genogram uses more symbol types. Make sure the key accounts for every line type and marker on the diagram.
- Export: download as PDF or PNG when done.
FAQ
What is a complex genogram?
A complex genogram maps a family with multiple layers of information; structural depth across several generations, multiple types of relationship dynamics, health history, blended structures, or a combination of these. It uses the same standard symbols as a basic genogram but applies more of them, across more people and more relationship types, to capture a family that a simpler diagram can't hold.
What is the difference between a basic and a complex genogram?
A basic genogram maps a family across two or three generations with a few key health notes and one or two relationship lines. A complex genogram goes further with more generations, relationship types, or multiple information layers present simultaneously. The symbols are the same; the scope and density are different.
What does a 4-generation genogram look like?
A four-generation genogram adds a fourth row to the standard three-generation format, typically the primary person's children, or great-grandparents depending on the direction of focus. The Bishop family example on this page shows a four-generation structure. The diagram becomes wider at each level, and following every branch quickly becomes unmanageable, so most four-generation genograms focus on one branch in depth.
How are genograms used in psychology?
In psychology and family therapy, genograms are used to map the family system around a client; identifying relational patterns, intergenerational transmission of behavior or health conditions, and the structural context of a presenting concern. A psychologist or therapist builds a genogram during assessment to understand where a client sits within their family system, not just as an individual. Complex genograms are particularly useful in this context because real clinical families rarely present with only one type of issue.
How do you read a complex genogram?
Start with the structure; identify the generations and the primary person before looking at anything else. Then read the health notes, starting from the oldest generation down. Then read the relationship lines, looking for patterns rather than individual connections. A complex genogram is meant to be read as a system, not line by line.
Sources
- Genograms: Assessment and Intervention (3rd ed.). W.W. Norton & Company.
- Family Therapy in Clinical Practice. Jason Aronson.