Appearance
Simple Genogram Example
A simple genogram is the fastest way to show a family’s current structure and a few key relationship patterns without adding extra generations. It is the standard starting point for intake sessions, student assignments, and quick family overviews where the goal is to understand the present household first.
What Is a Simple Genogram?
A simple genogram maps one family across two generations: usually the parents and their children. It shows who is in the family, how they are related, and, critically, how they relate to each other emotionally.
Unlike a family tree, which only documents lineage, a genogram documents functioning. The lines between people carry meaning across closeness, distance, conflict, and estrangement.
Thus, a simple two-generation genogram with well-chosen relationship lines tells you a lot about a family in thirty seconds.
A Simple Genogram Example: The Marshall Family
This is an interactive example. You can study it, click into it, and edit it directly.
Simple Genogram Example
What This Genogram Shows
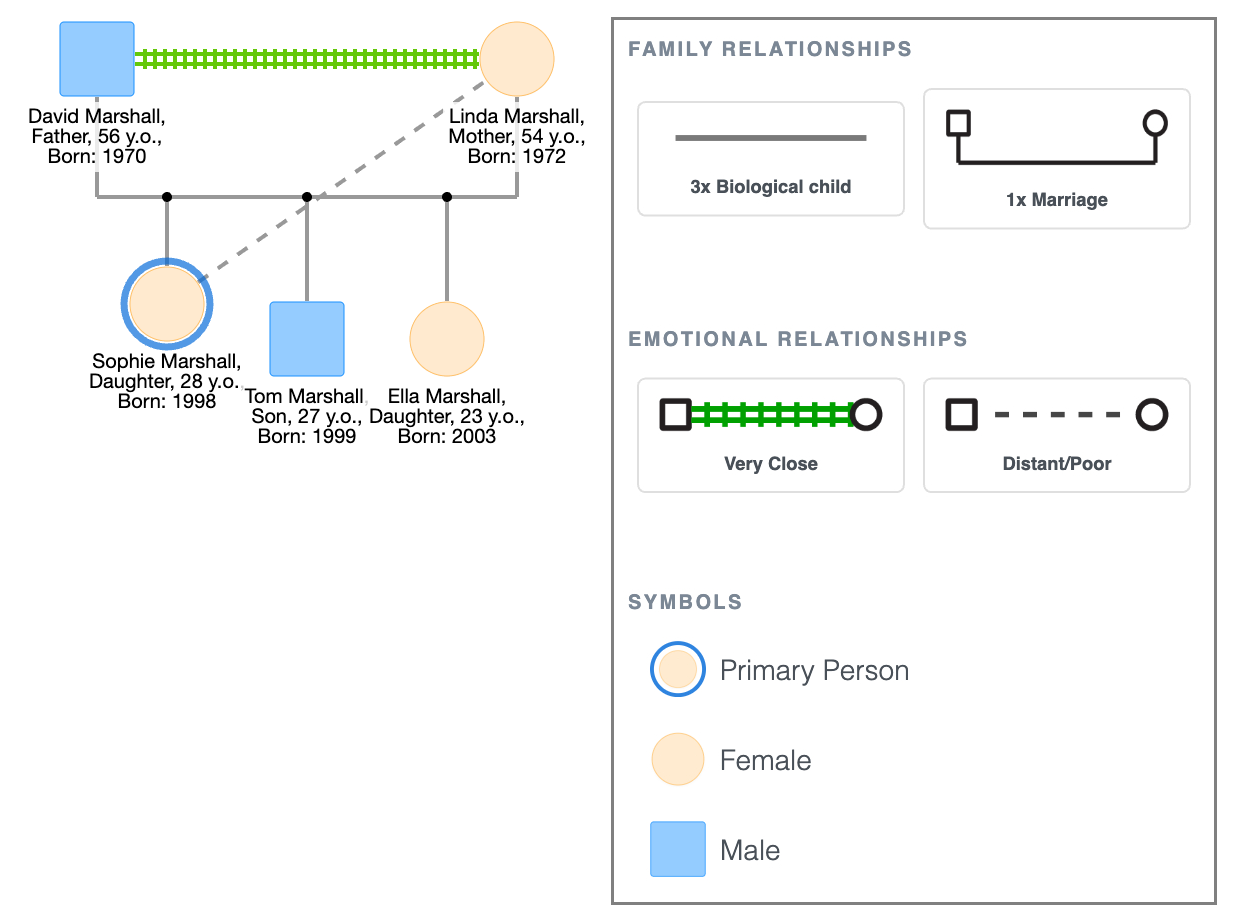
The Marshall family genogram covers two generations: the parents and the children.
- David (square) and Linda (circle) are the parents. Squares represent males, while circles represent females.
- The horizontal line connecting beneath David and Linda shows they’re married.
- They have three biological children: Sophie, Tom, and Ella. A vertical line branches from the marriage line to each child, arranged horizontally to show they’re siblings.
- Sophie has a double circle, marking her as the primary person: the individual whose family system the genogram is built around.
- The thick line between David and Sophie indicates a close, warm relationship.
- The dashed line between Sophie and Linda, however, indicates emotional distance. Despite their biological connection, there is a meaningful gap in their relationship. This is not a hostile or estranged relationship, but it is one marked by unavailability and lack of attunement.
Other symbols exist for conflict, estrangement, and death, but a simple genogram includes only the markers necessary to represent core relationships.
Simple Genogram Example
Explore this genogram and adapt it to your needs.
Who Uses Simple Genograms, and When?
A two-generation genogram is the right choice when the goal is to establish baseline family structure and immediate relational patterns. It answers one question: who is in this family, and how do they relate to each other right now?
- Students: Psychology, nursing, social work, and counselling programmes usually introduce genograms through simple examples. It is the standard starting point for most coursework assignments.
- Therapists and counsellors: Early sessions frequently use a simple genogram to map immediate family structure before deciding whether to go deeper. It is fast, collaborative, and gives the client something concrete to engage with.
- Social workers: Family assessments often begin with a two-generation genogram to establish household composition and relationships before expanding the picture.
- Medical professionals: A simple genogram at clinical intake quickly captures family composition and immediate relational context, without requiring the patient to provide an extensive family history.
N.B.: Know the limits. A simple genogram cannot show the complexity in blended families, intergenerational trauma, addiction history, or patterns that repeat across generations. When the present cannot be understood without the past, two generations are not enough. Move to a 3-generation genogram when history matters as much as the current picture.
How to Build Your Own Simple Genogram
The Marshall family genogram is fully editable; you can replace the names, adjust the relationships, and adapt the markers to any family you’re working with.
To build a simple genogram:
- Place parents or guardians in the top row, with the children below.
- Mark the primary person.
- Add the necessary relationship lines (the ones you can confirm).
- Leave anything uncertain unmarked and return to it later.
For families where history and pattern matter as much as the current structure, see the 3-Generation Genogram Example.
FAQ
What is a simple genogram example?
A simple genogram example shows one family across two or more generations, usually the parents and children, with relationship lines marking how they connect emotionally. The Marshall family genogram example on this page is a fully interactive example you can study and edit directly.
What do the symbols in a simple genogram mean?
Squares represent males, circles represent females. A double circle or double square marks the primary person, which is the individual the genogram is built around. Lines between people show relationship quality; for instance, a thick line means close, a dashed line means distant, and a jagged line means conflictual.
Is there a simple genogram example I can download as a PDF?
You can export any genogram you build on this page as a PDF using the export button. The Marshall family example above is fully editable; adjust the names and relationships to fit your needs, then export it for your assignment or assessment.
What is the difference between a family genogram and a family tree?
A family tree documents who belongs to a family, while a genogram documents how they relate to each other. For clinical, academic, or therapeutic purposes, genograms matter more.
Sources
- Genograms: Assessment and Intervention
- The Genogram Journey: Reconnecting with Your Family