Appearance
How to Create an Ecomap
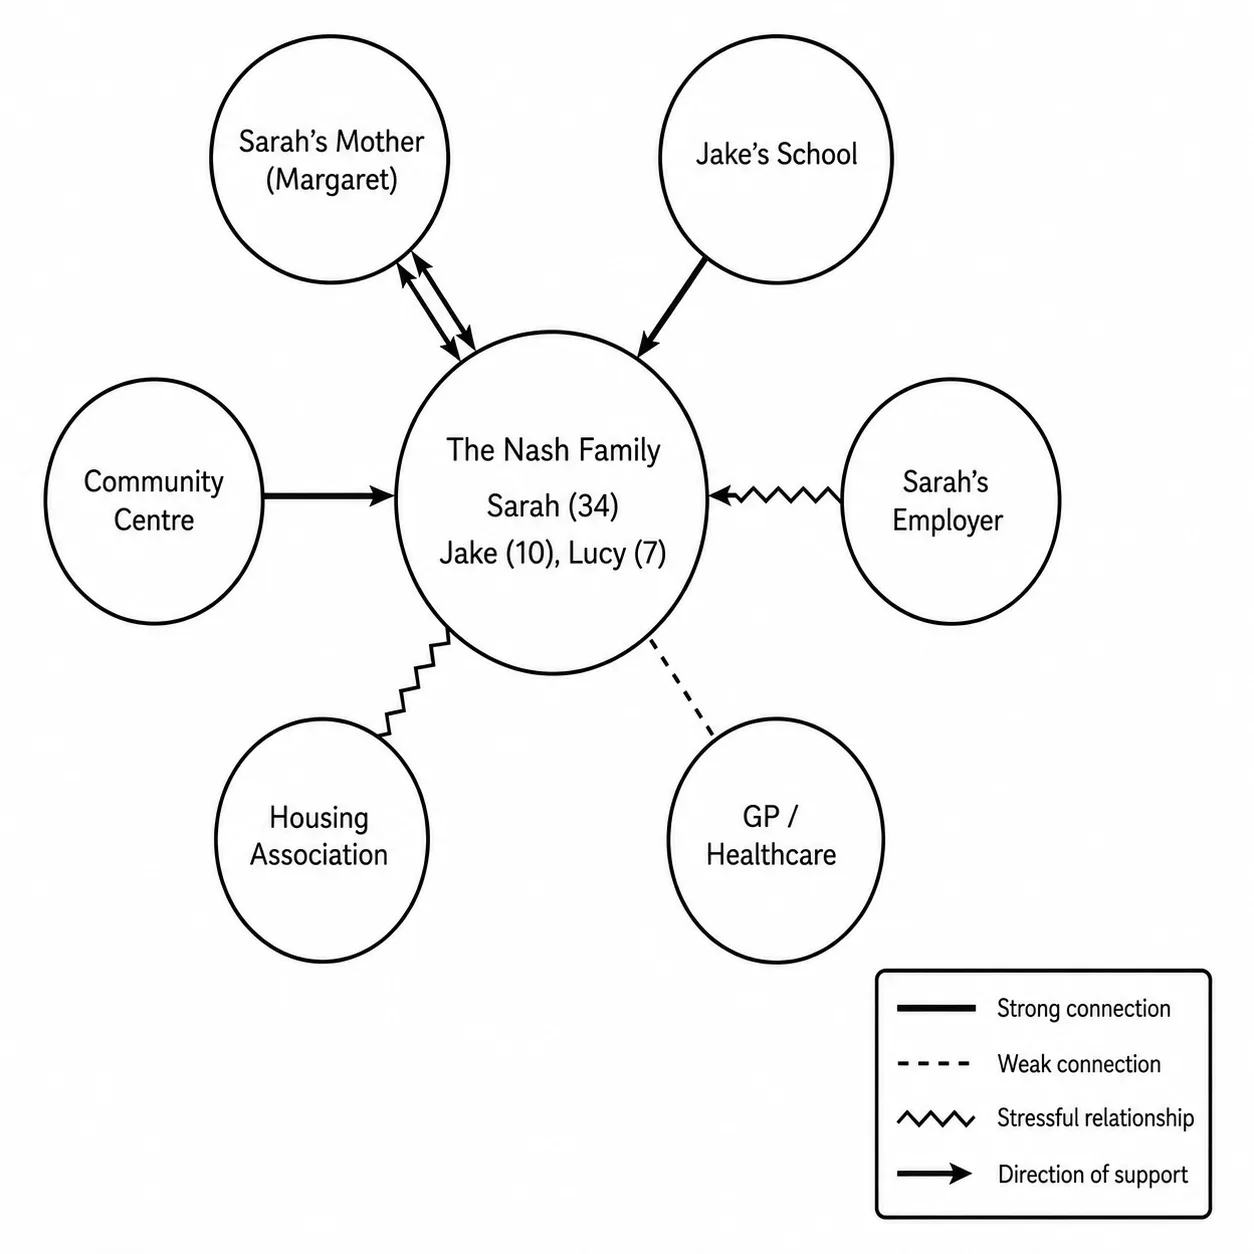
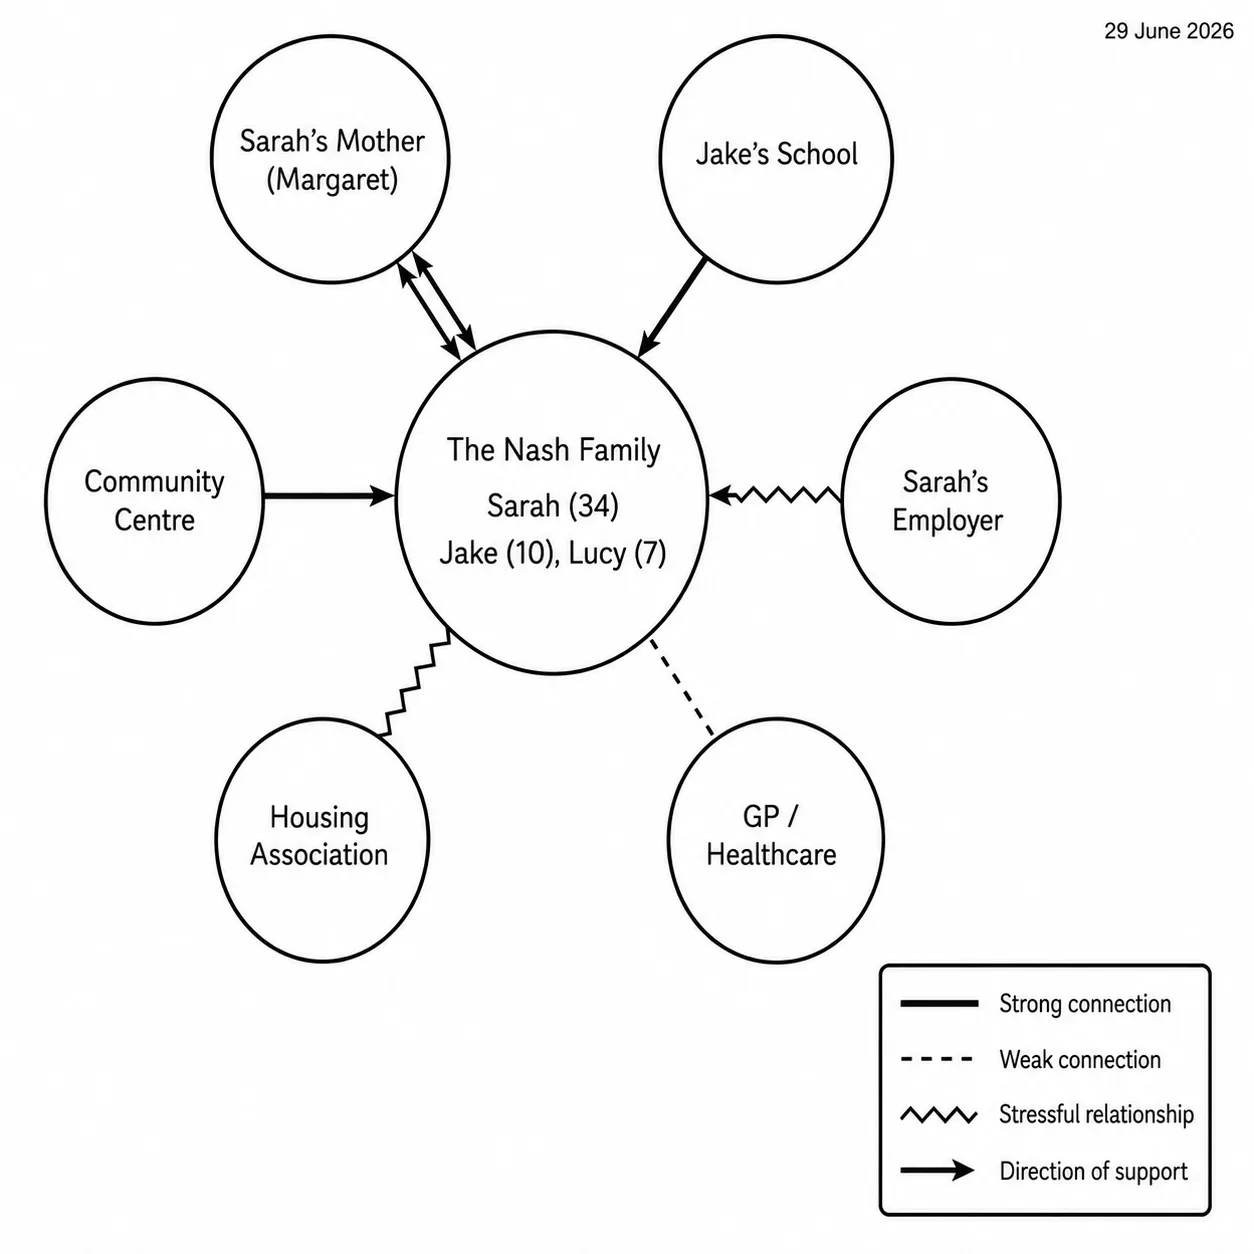
To create an ecomap, place the person or family in a large circle at the center, draw smaller circles for each external system around them, and connect the circles with lines showing whether each relationship is strong, weak, or stressful. Add arrows to show which way support flows, include a key, and date the diagram.
Before You Start
Who goes in the center?
An ecomap can center on an individual or a family unit.
- For a family, write all household members' names inside the center circle.
- For an individual, write their name alone.
Everything else in the diagram is built around whoever sits at the center.
What is the ecomap for?
The purpose determines which external systems to include.
- Social work ecomap: includes formal services, caseworkers, and statutory connections.
- Nursing ecomap: focuses on healthcare systems, community support, and recovery environment.
- Family therapy ecomap: maps informal and community connections alongside formal ones.
- Personal ecomap: includes whatever systems are significant to the person's life.
Decide before you start drawing, as it saves you from adding and removing circles mid-way through.
Step-by-Step: How to Create an Ecomap
These are six steps on how to create an ecomap.
Step 1: Draw the center circle
Draw a large circle in the middle of your page or canvas.
Write the name of the person or family inside it.
If mapping a family, include all household members.

This circle is the anchor for the whole diagram; make it large enough that the outer circles don't crowd it.
Step 2: Identify the external systems
Before you draw anything else, list the systems you want to include. Work through the main categories:
- Family members outside the household
- Schools or childcare
- Employers
- Healthcare providers
- Faith communities
- Friends and neighbors
- Social services or formal agencies
- Housing or financial systems
- Community organizations
Include only the systems that are currently significant; not every possible connection. An ecomap with 15 outer circles is harder to read than one with 7 well-chosen ones.

Step 3: Draw the outer circles
Place a smaller circle for each system around the center.
Label each one clearly.
Position matters loosely; systems with stronger connections can sit closer to the center, distant or stressful ones can sit further out, but there is no fixed rule.
Use whatever layout makes the diagram readable.

Step 4: Draw the connecting lines
Connect each outer circle to the center with a line. Choose the line type based on the quality of the relationship:
- Thick or double solid line - strong, positive connection.
- Thin dashed line - weak, distant, or underused connection.
- Zigzag or jagged line - stressful or conflictual relationship.

For a full reference of line types and what each one means, see the ecomap symbols guide.
Step 5: Add directional arrows
Place arrows on each line to show which way support flows:
- Arrow pointing toward the center - the system gives support to the person or family.
- Arrow pointing away from the center - the person or family gives support to that system.
- Arrows at both ends - mutual, reciprocal support.

Not every connection needs an arrow.
If the direction of support is unclear or not relevant for a particular connection, leave the arrow off.
Step 6: Add a key
Write a small legend on the diagram listing every line type used and what it means.
Anyone reading the ecomap without context needs to be able to interpret it without asking.
An ecomap diagram without a key is incomplete.
Step 7: Add the date
Write the date the ecomap was completed.
Ecomaps are snapshots; they show how a person's connections look at a specific point in time.
Without a date, the diagram loses its value as a record when the situation changes.
Common Mistakes
1. Including too many outer circles
A crowded ecomap is harder to read than a focused one.
Aim for the systems that are genuinely significant, not an exhaustive list of every connection the person has ever had.
2. Leaving out stressful connections
Stressful systems belong on the diagram.
An ecomap that only shows positive connections gives an incomplete picture.
The zigzag lines are often where the most important assessment information sits.
3. Forgetting directional arrows
The direction of support is one of the most clinically useful things the ecomap shows.
A connection that looks supportive with a solid line may actually be taking energy away from the person; the arrow reveals that.
4. No key
Every symbol and line type on the diagram needs to appear in a legend.
Skipping the key assumes the reader knows the notation, which is not always true.
5. No date
A social worker reviewing a case six months later, or a nursing student referring back to an assessment, needs to know when the diagram was completed.
Undated ecomaps are difficult to use as progress records.
FAQ
How do you create an ecomap step by step?
Start with a large circle containing the person or family at the center. Add smaller labeled circles for each significant external system. Connect each outer circle to the center with a line; solid for strong, dashed for weak, zigzag for stressful. Add directional arrows to show which way support flows. Write a key listing every line type used, and add the date the diagram was completed.
What should be included in an ecomap?
The center circle contains the person or family. The outer circles represent external systems: family members outside the household, schools, employers, healthcare providers, faith communities, friends, social services, housing, and community organizations. Include only the systems that are currently significant. Lines show relationship quality; arrows show the direction of support. A key and a date complete the diagram.
How do you create an ecomap in social work?
The process is the same as a standard ecomap, with a few practice-specific points. Complete the diagram with the client where possible; the conversation during the drawing is part of the assessment. Include formal services (caseworkers, statutory agencies, housing authorities) alongside informal supports. Use the diagram at intake to establish the current situation, and save dated versions to track changes over time.
How do I create an ecomap in Word?
Use Insert → Shapes to draw ovals for the center and outer circles. Use the Line tool for connecting lines, and format each line's style (solid, dashed) through the Format Shape menu. Zigzag lines need to be drawn manually using the Freeform tool. Add a text box for the key. Word is functional for a basic ecomap but lacks the native tools that make the notation clean; a whiteboard or diagramming tool will produce a clearer result in less time.
What is the easiest way to create an ecomap online for free?
Any whiteboard tool that supports shapes and connectors, such as FigJam, Canva, or Google Slides works for a basic ecomap. Draw a large circle for the center, add smaller circles for each system, connect them with lines, and adjust the line styles to match the notation.
Sources
- Diagrammatic assessment of family relationships. Social Casework, 59(8), 465–476.
- The Ecology of Human Development. Harvard University Press.
Related
- Ecomap Guide
- Ecomap Symbols
- Ecomap Template
- Ecomap Social Work
- Ecomap Example
- Ecomap Family
- Ecomap and Genogram
- How to Create an Ecomap in Word