Appearance
How to Make a 3 Generation Genogram
A 3-generation genogram maps grandparents, parents, and children in one diagram so you can see patterns across the family instead of just one household. It is the standard format for most class assignments, clinical intakes, and family health assessments. These steps walk through the full build from the first generation down to the third.
Before You Start
Two generations show you relationships, but three generations show you patterns; what repeats, what skips, what started before the person you're focusing on was born.
If your assignment or purpose only requires two generations, Simple Genogram Example covers that. If you want a ready-made layout before you start drawing, open the 3 Generation Genogram Template.
How to Make a 3 Generation Genogram: Step by Step
These are six steps to make a three-generation genogram.
Step 1: Gather information for all three generations
Three generations means three sets of people to collect information for, and the grandparent generation is usually the hardest. Dates are less certain, health histories are less documented, and some information only exists in someone's memory.
Collect for each person: name, gender, age or birth year, relationship to others, cause of death for deceased members, and any health conditions or significant life events relevant to your purpose.
For this walkthrough, we'll use the Nolan-White family, and here’s information on them:

Two things are already visible in this table before drawing anything: a cardiovascular condition on Frank's side and a metabolic condition on Joan's.
That’s the story the diagram will tell, but only once all three levels are in place.
Once you have the information, open the EasyGenogram tool and use the "Multi generations" template to set up the basic three-level structure before adding details.
Step 2: Build the first generation
- Click the + button on the canvas to add a person, or drag a shape from the sidebar.
- Place Frank on the left. Click his shape; the quick-add buttons appear. Click Add Partner to add Joan, and EasyGenogram draws the marriage line between them automatically.
- Frank is deceased; click his shape and mark him as deceased to add the X.
1st Generation Genogram
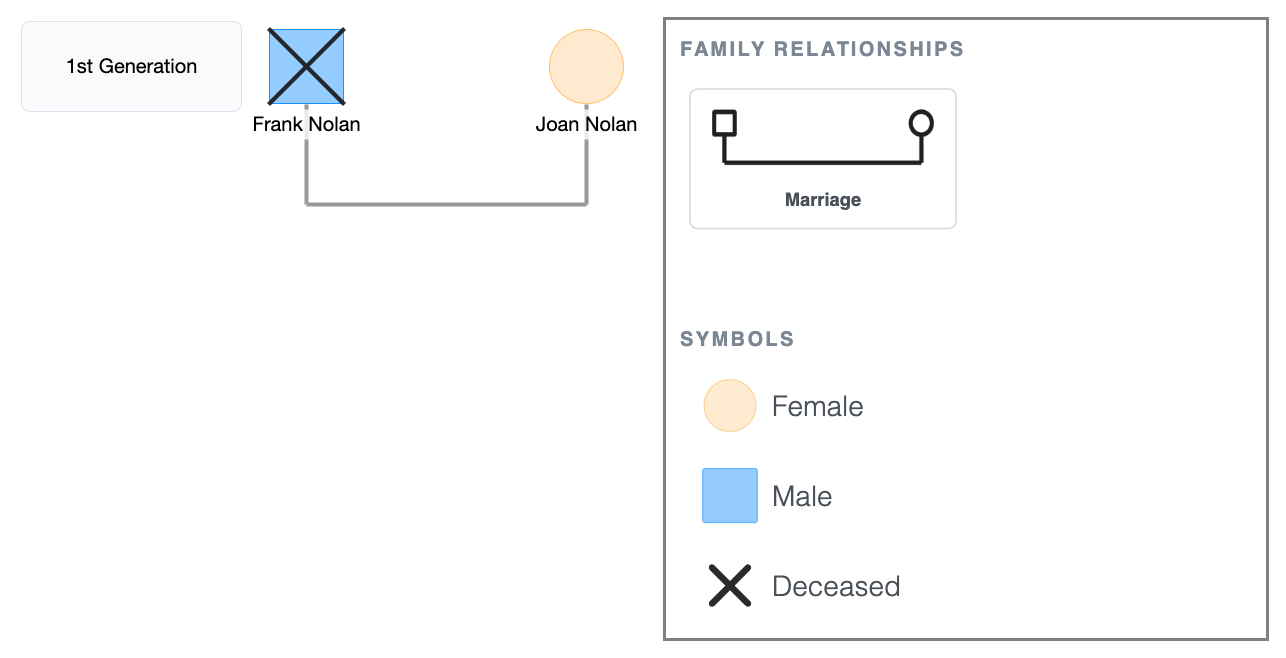
This is what a genogram looks like with just one generation.
It shows two people and their relationship. In this case, Frank and Joan were married, then Frank passed away.
But it doesn't yet tell you anything about what happened to them or whether any of it continued.
1st Generation Genogram
Explore this genogram and adapt it to your needs.
Step 3: Add the second generation
- Click Frank or Joan's shape; the quick-add buttons appear. Click Add Children to place Daniel and Claire below, already connected to the generation above.
- Birth order runs left to right; move Daniel to the left and Claire to the right.
- Mark Daniel as the primary person.
- Click Daniel's shape and select Add Partner to add Rachel. EasyGenogram draws the marriage line automatically.
- Click Claire's shape and select Add Partner to add Owen. Drag Owen to Claire's left so the couple pair reads as male left, female right.
2nd Generation Genogram
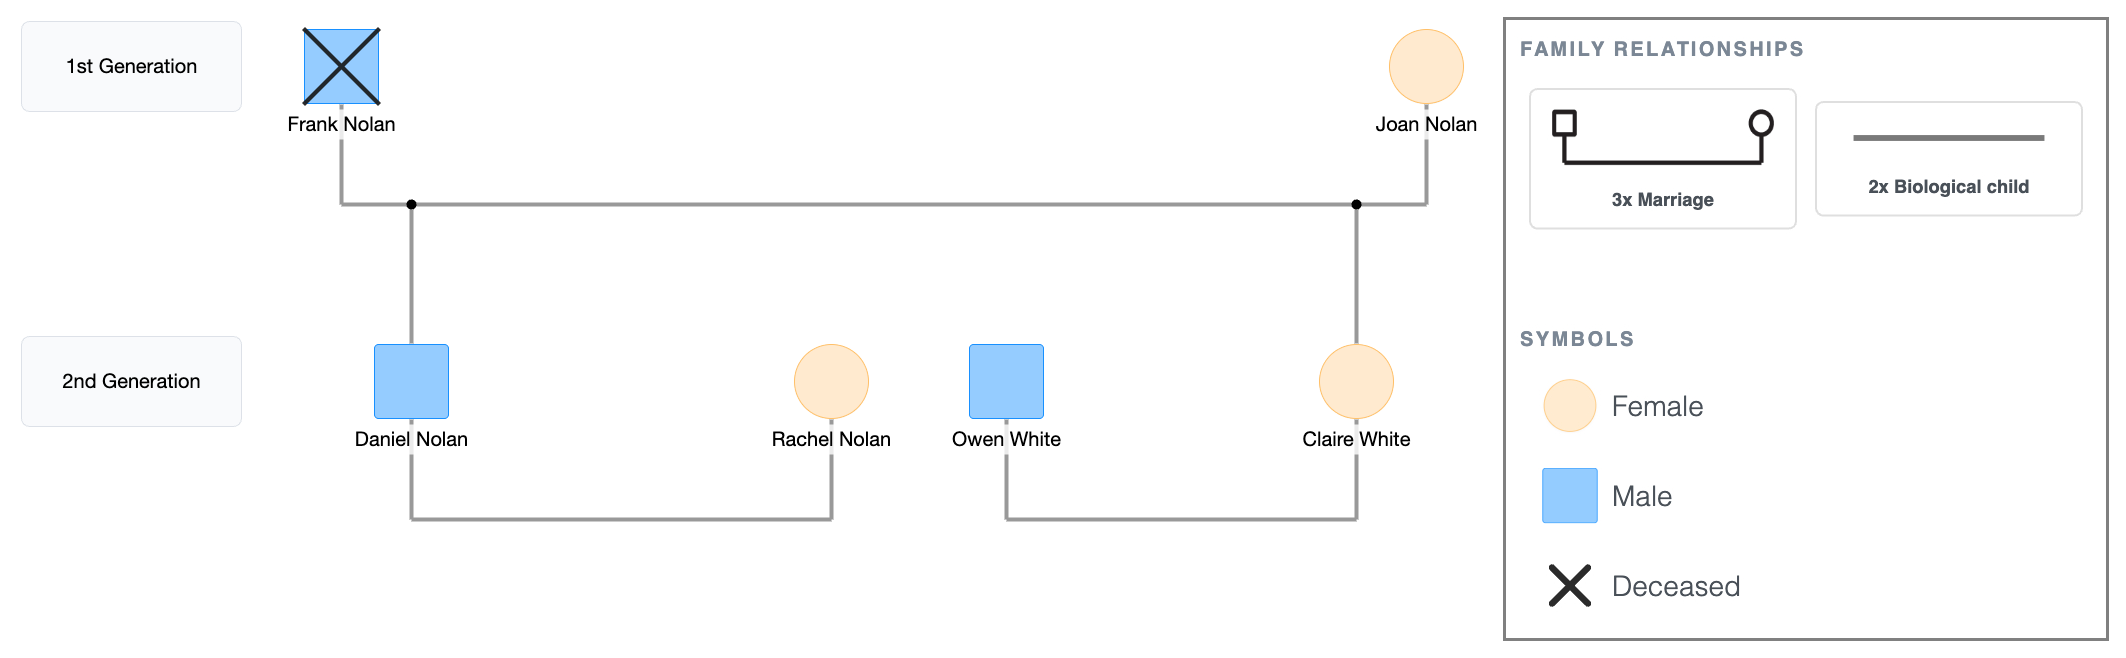
Now the diagram shows two generations.
You can see that Daniel and Claire are Frank and Joan’s children, and the partners of these children are Rachel and Owen. You can also see the family’s structure gradually coming to life.
Step 4: Add the third generation
- Click Daniel or Rachel's shape and select Add Children; Sam and Ella drop in below their marriage line.
- Move Sam to the left and Ella to the right.
- Click Claire or Owen's shape and select Add Children; Max drops in below their marriage line.
3rd Generation Genogram
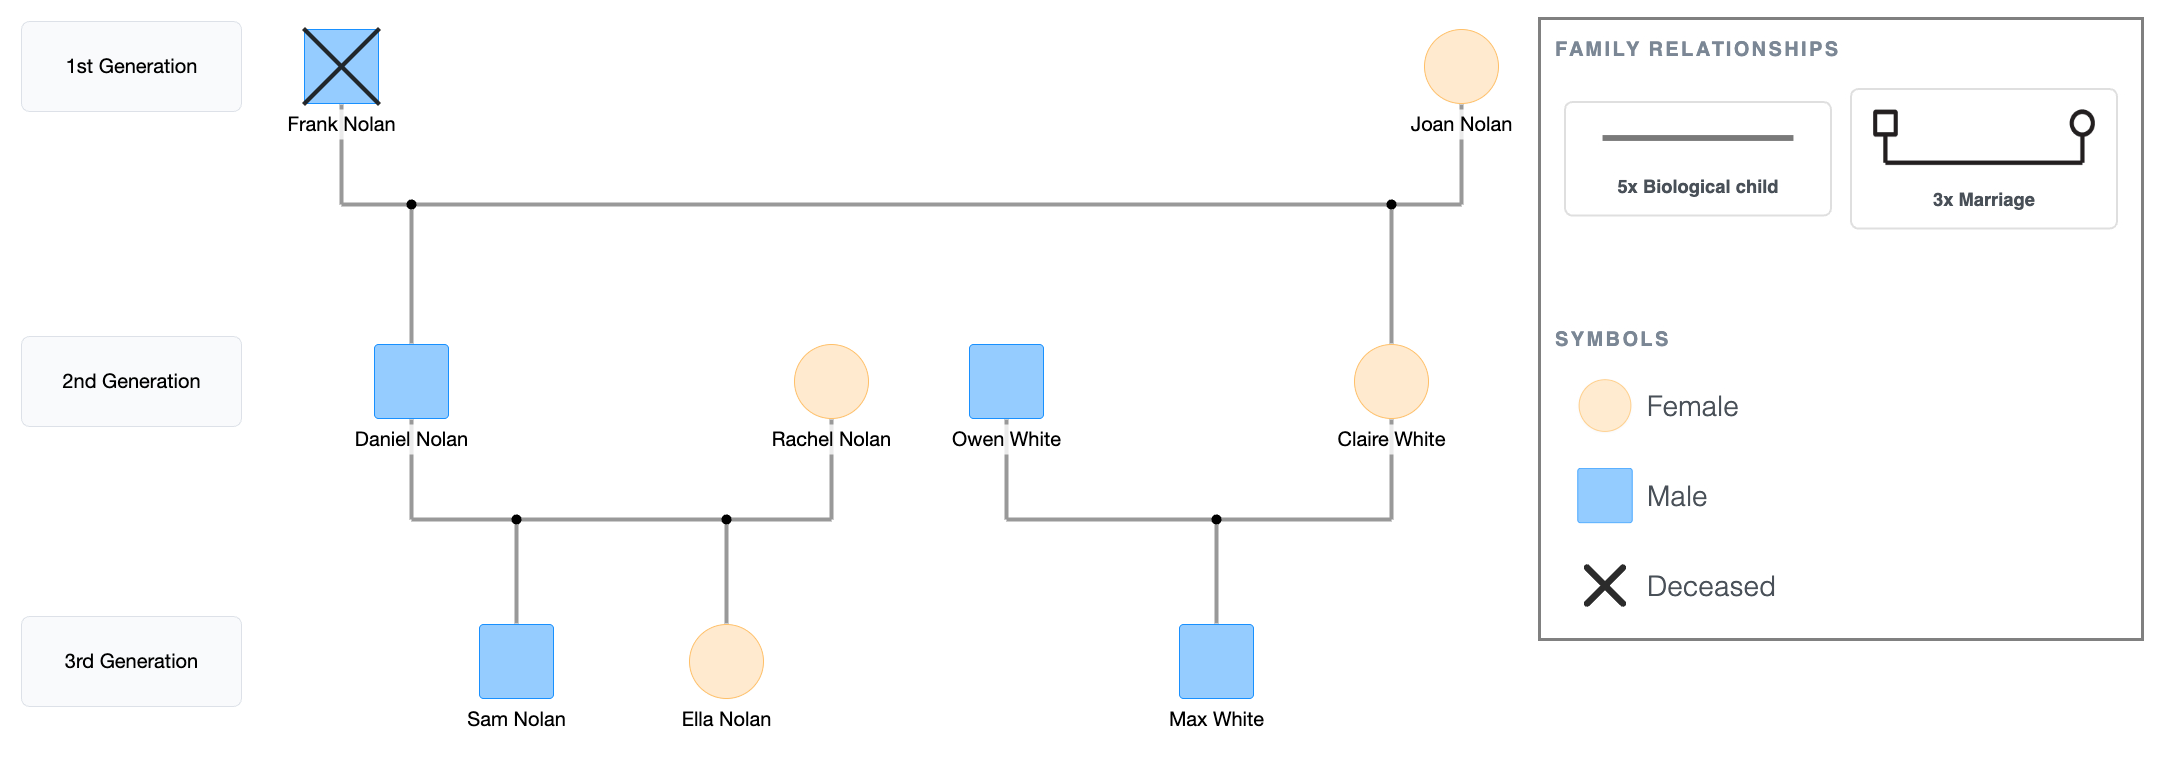
The diagram now shows three generations.
Look at where the children sit: directly beneath Daniel, Rachel, Owen and Claire, who all sit directly beneath Frank and Joan.
This third generation hasn’t surfaced anything yet, but the family members are now all visible in a way that a two-generation genogram couldn't show.
Step 5: Add relationship lines and relevant notes
Add ages, health conditions, and any other relevant notes directly on or near each person's shape.
For the Nolan-Whites:
- Frank: heart condition, deceased at 74.
- Joan: type 2 diabetes, age 71.
- Ages on all remaining family members.
Then draw emotional relationship lines after the structure is complete so they route cleanly around existing connections. To do this:
- Click Joan's shape; the quick-add buttons appear. Click Connect, then click Daniel's shape. A relationship picker pops up; select the cutoff symbol.
- Click Joan's shape again, click Connect, then click Claire's shape. Select the closeness line from the picker.
3rd Generation Genogram Showing Health Conditions & Emotional Relationships
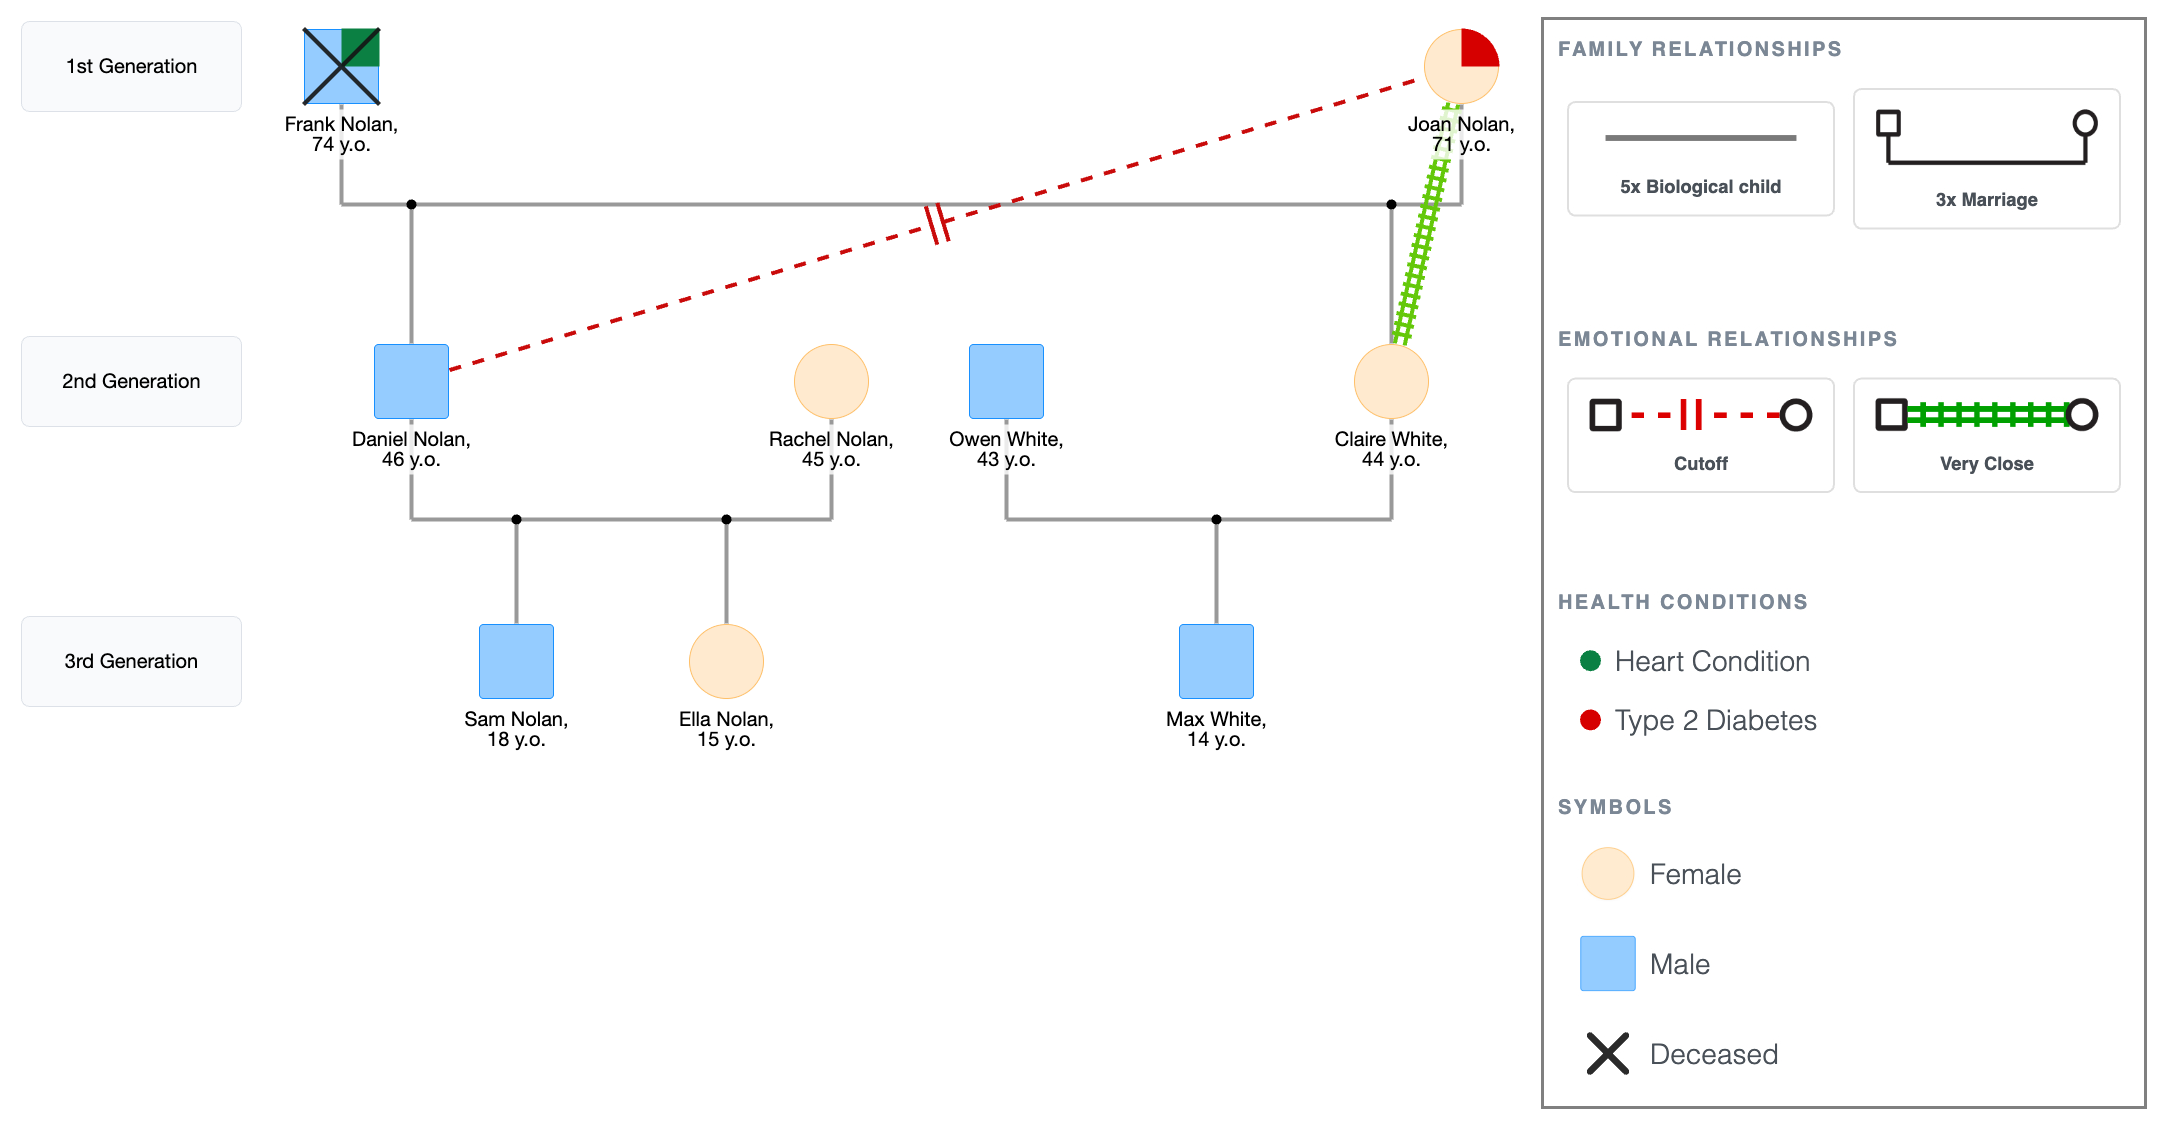
From this diagram, you can now see a full family picture showing:
- History of heart condition.
- History of diabetes.
- Cutoff relationship between a mother and her son (Joan and Daniel).
- Very close emotional relationship between a mother and her daughter (Joan and Claire).
You can now begin to see patterns where they are likely to appear, and predict as such.
3rd Generation Genogram Showing Health Conditions & Emotional Relationships
Explore this genogram and adapt it to your needs.
Step 6: Review and export
Before you export, run through this checklist to avoid the common mistakes in making a genogram:
- Spacing across all three generations is even and nothing is crowded.
- The primary person has a double outline.
- Children connect to the sibling bar and the parents’ marriage line, not directly to a parent's shape.
- Each generation sits on the same horizontal level.
- Health fields for the relevant people are filled in.
- Biological child connection lines are vertical, not angled.
On what to include:
- For a class assignment, names, ages, structural lines, basic health conditions for the grandparent generation, and a legend are enough; add emotional lines only if the assignment requires them.
- For clinical use, add emotional lines, full health history, and cause of death for all deceased members. If information is missing, mark it with a question mark symbol or leave the field blank.
Then look at the completed diagram and ask what the third generation added.
For the Nolan-Whites:
- Frank and Joan now have three grandchildren sitting beneath them; Sam, Ella, and Max, none of whom have any conditions noted yet.
- However, the diagram makes that lineage visible in a way a written health history doesn't.
- Whether any of it surfaces in their generation is a separate question. The point is that now, there's a record to return to.
That's the difference between two generations and three. Two shows you the present structure, while three gives you something to read over time.
For completed three-generation examples with annotations, see 3-generation genogram examples.
After checking through the above necessities, tap PNG or PDF in the top bar to export the genogram.
3rd Generation Genogram Showing Health Conditions & Emotional Relationships
Explore this genogram and adapt it to your needs.
FAQ
What is a 3 generation genogram?
A three-generation genogram maps three levels of a family; grandparents, parents, and children, using standardized symbols for gender, relationships, and significant life events. It's the standard minimum for most clinical and academic genogram work because three generations is where patterns first become visible across the diagram.
Why do most assignments require three generations and not two?
Two generations show you just the family's current structure. Three generations show you what preceded it, including health conditions, relationship dynamics, and behavioral patterns that existed before the primary person was born. That historical layer is what makes a genogram clinically or academically useful rather than just a family map.
How do I start a genogram when I don't have all the information?
Start with what you have and leave the rest blank. Use a question mark symbol for unknown genders and leave health fields empty where you genuinely don't know. An incomplete genogram is still useful; the gaps are part of the picture, and the diagram can be updated as more information becomes available.
How is a 3 generation genogram different from a family tree?
A family tree shows lineage, just names, dates, and descent, while a three-generation genogram adds relationship quality, health conditions, emotional patterns, and significant life events. A family tree tells you who the family is; a genogram shows how it works across generations.
Can I make a 3 generation genogram for free?
Yes. EasyGenogram is free to use. The "Multi generations" template sets up the three-level structure automatically, and you can export as PDF or PNG when done.
Sources
- Genograms: Assessment and Treatment (4th ed.)
- Genograms for Psychotherapy
Related
How to Make a Genogram (Step-by-Step Guide)