Appearance
Community Genogram
A community genogram maps a family's connections to institutions, resources, and social networks alongside its standard family structure, showing how those ties have strengthened or weakened across generations rather than just what a family's support system looks like today.
What a Community Genogram Adds
A standard genogram maps who's related to whom and how those relationships function.
A community genogram adds a layer on top:
- Institutional connections: church, school, healthcare, local employers.
- Connection quality: what kind of relationship the family has with each one.
Where this differs from an ecomap is time depth.
An ecomap captures a single household's current environment as a snapshot. A community genogram traces how a family's institutional connections have shifted across three generations, which is often where the more useful pattern actually sits.
The Hollis Family
Community Genogram Example
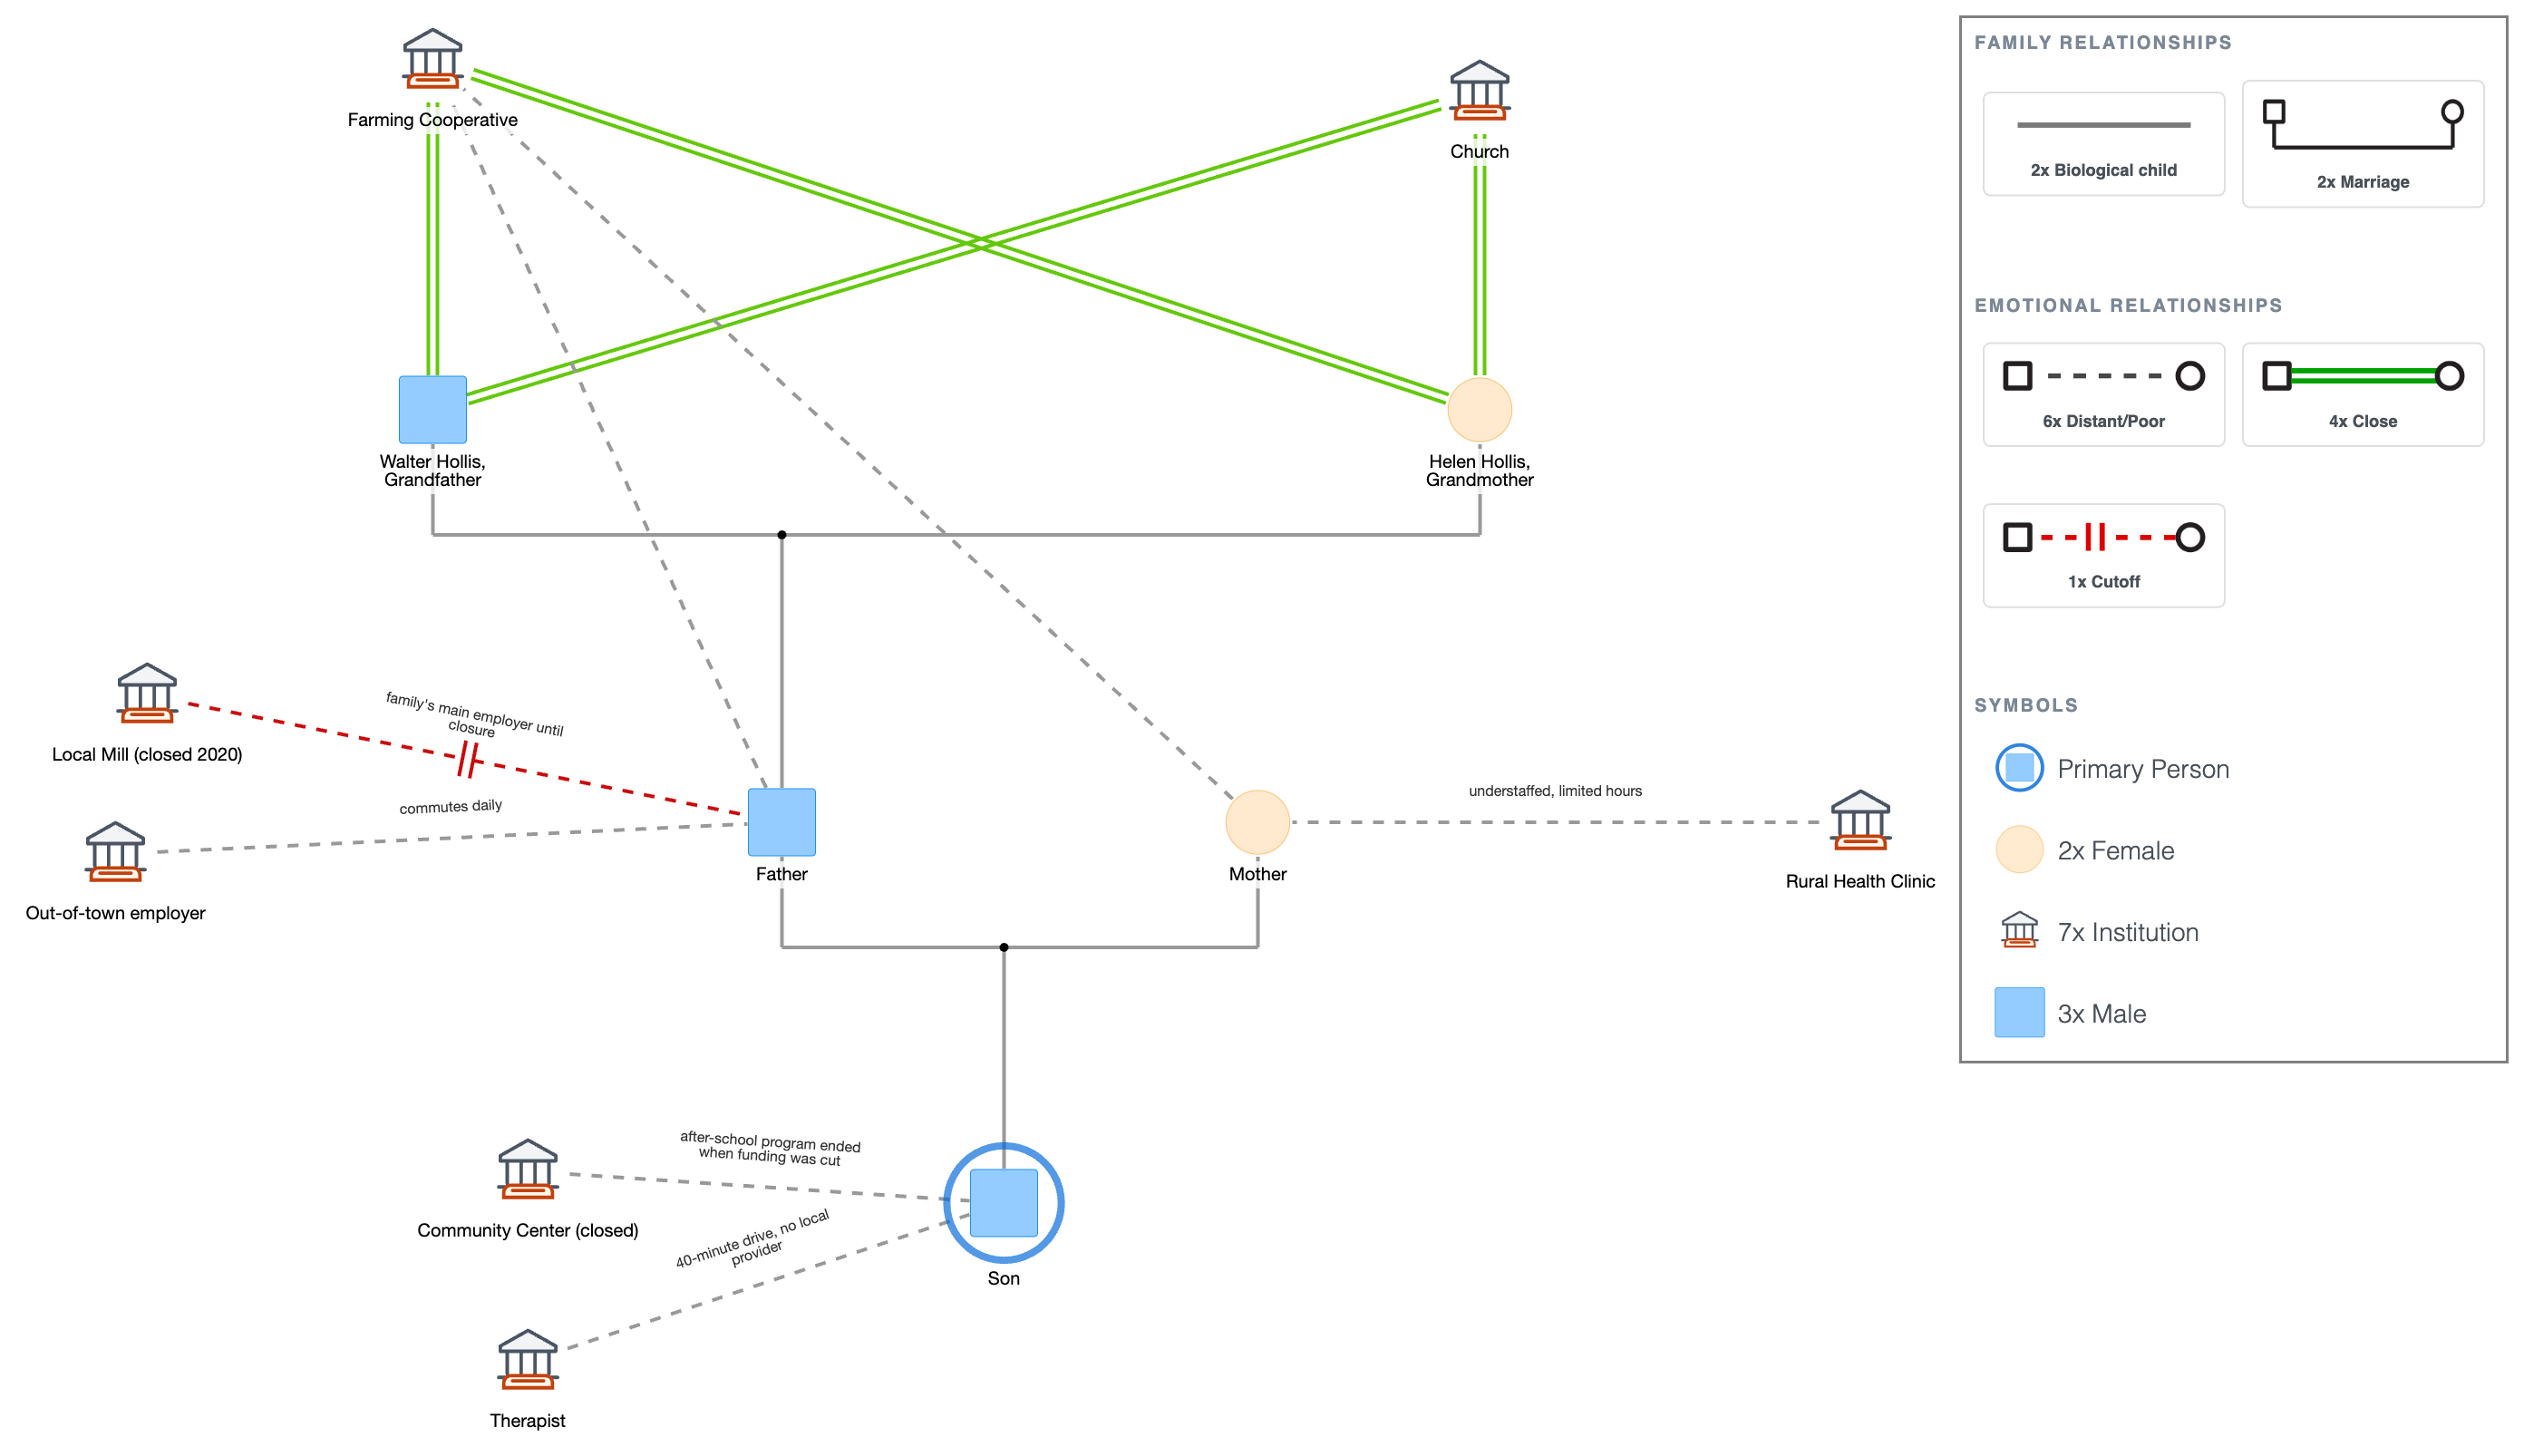
- Grandparents: Close ties to the local farming cooperative and church, lifelong residents.
- Parents: father commutes out of town after the local mill closed, Distant line to former community ties; mother connected to an understaffed rural health clinic.
- Teenage son: primary person, Distant line to community resources, no local after-school program, nearest therapist 40 minutes away.
The Hollis family's teenage son was referred to counseling after months of increasing withdrawal and a drop in grades.
On its own, that referral looked like an individual issue.
Mapped alongside the family's community connections across three generations, it looked like something else.
What the Genogram Revealed
The grandparents' generation showed dense, stable community ties; decades of involvement in the local farming cooperative, regular church attendance, and a network of neighbors who'd known the family for years.
The parents' generation showed the first real thinning of those ties, not through any personal choice, but because the town's mill, the area's main employer, closed years ago.
The father now commutes out of town for work, and the family's day-to-day presence in the community they grew up embedded in has quietly shrunk.
By the time it reached the son's generation, the erosion had compounded.
The community center that used to run an after-school program lost its funding and closed.
The nearest therapist is a forty-minute drive each way.
His isolation isn't just personal; it's the latest point in a three-generation pattern of the community's institutional fabric thinning out around the family.
How This Shaped the Plan
Seeing the pattern across three generations changed what the counselor recommended.
Instead of treating the son's withdrawal as solely an individual mental health concern, the plan included telehealth sessions to work around the distance to in-person care, and a conversation with the family about what, if any, community connections from the grandparents' generation might still be accessible.
The church, in particular, still had regular gatherings the family had drifted away from without any deliberate decision to do so.
None of this replaced individual treatment but gave the treatment a more accurate starting point.
Build One for a Session
Start with the standard three-generation family structure, then add each generation's key institutional connections; church, school, healthcare provider, local employer, community organizations.
Mark the quality of each connection, Close, Distant, absent entirely, and note when and why a connection changed, a job loss, a program closing, a family relocating.
Look specifically for whether ties have strengthened or thinned across generations rather than only recording the present situation.
For the full guide, see How to Make a Genogram.
Community Genogram Example
Explore this genogram and adapt it to your needs.
FAQ
What is a community genogram?
It's a genogram that layers a family's institutional and community connections, church, school, healthcare, employment, onto the standard multigenerational family structure, showing how those ties have changed across generations rather than only what they look like today.
What is the goal of a community genogram?
The goal is to see a client's situation within its full social and institutional context, not just their family relationships. A presenting issue that looks purely individual, like the Hollis son's withdrawal, often makes more sense once the surrounding community pattern is visible.
What is an example of a genogram like this?
The Hollis family genogram in this article is one example; three generations tracing a farming community's strong local ties eroding after a local employer closed, ending in a teenager with almost no community-based support left nearby.
How is a community genogram useful in a rural setting specifically?
Rural areas often have fewer institutions to begin with, so losing even one, a community center, a local clinic, a single employer, has an outsized effect on a family's support network. Mapping that loss across generations makes the cumulative impact visible in a way a single conversation usually doesn't.
Does every community genogram need to show a decline in community ties?
No. Some show the opposite, a family building stronger institutional connections over time, particularly after a move or a major life change. The value is in tracing the actual trajectory, whichever direction it goes, not assuming decline or growth in advance.
Sources
- Community genograms: Using individual, family, and cultural assessment
- Genograms: Assessment and Intervention (4th ed.)