Trusted by Mental Health Professionals
See what therapists, social workers, and counselors are saying
"The genogram tool alone is worth it. I've tried other practice management software, but TheraConnect Pro understands the unique needs of family therapists."
Jennifer R., LMFT
Family Therapist"I've cut my admin time in half. The automated invoicing and scheduling features have made my practice so much more efficient."
Michael T., LCSW
Clinical Social Worker"My clients love the portal - it makes paperwork and scheduling so much easier. Plus, the platform security gives me peace of mind."
Sarah K., LPC
Licensed Professional Counselor142,000+
Packages managed
2,800,000+
Sessions scheduled
8,700,000+
Worksheets and resources shared
All you need in one place
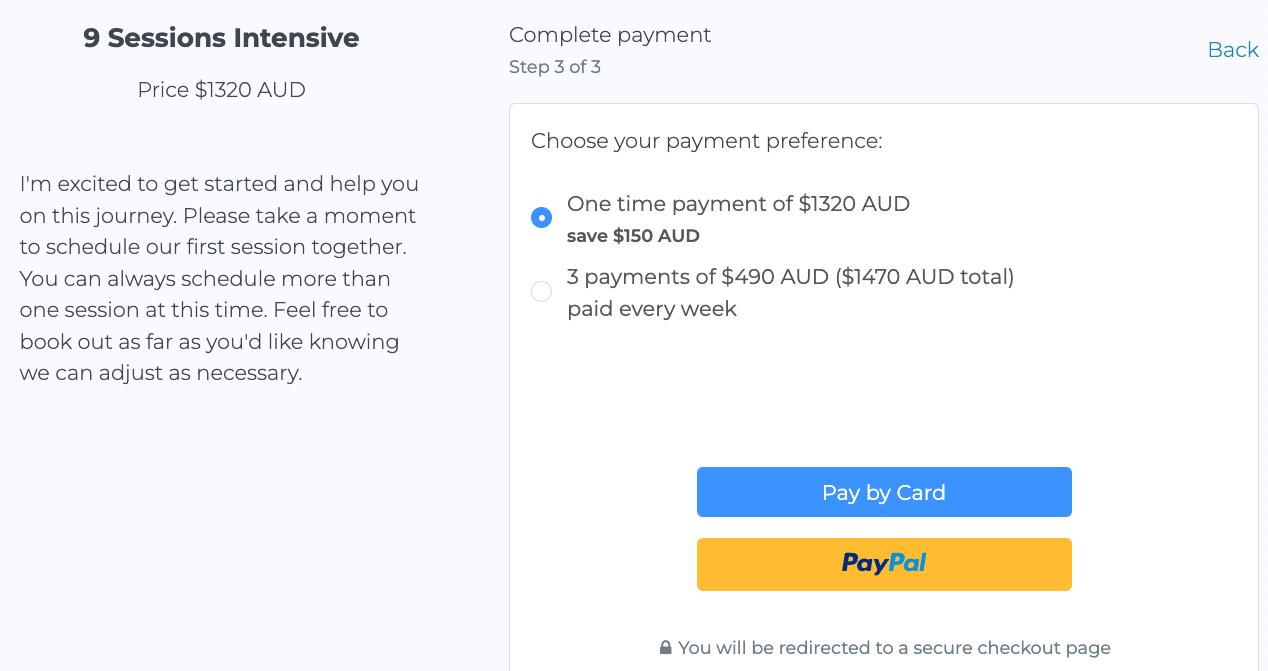
Sell one-off sessions, one-on-one or group packages.
Setup your offers in a few clicks.
Let your clients pay in full or in portions with automatic payments based on your payment schedule.
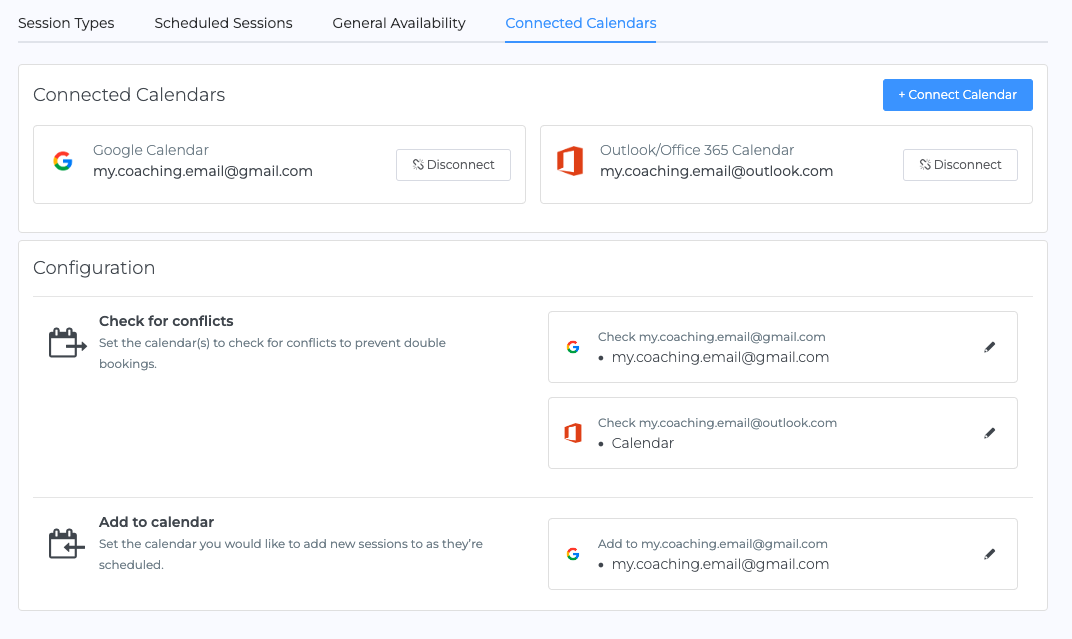
Two-way calendar sync to streamline booking.
It's like Calendly But Built For Practitioners
Schedule a single or multiple sessions at once. Let your clients schedule or do it for them. You are in full control of the flow.
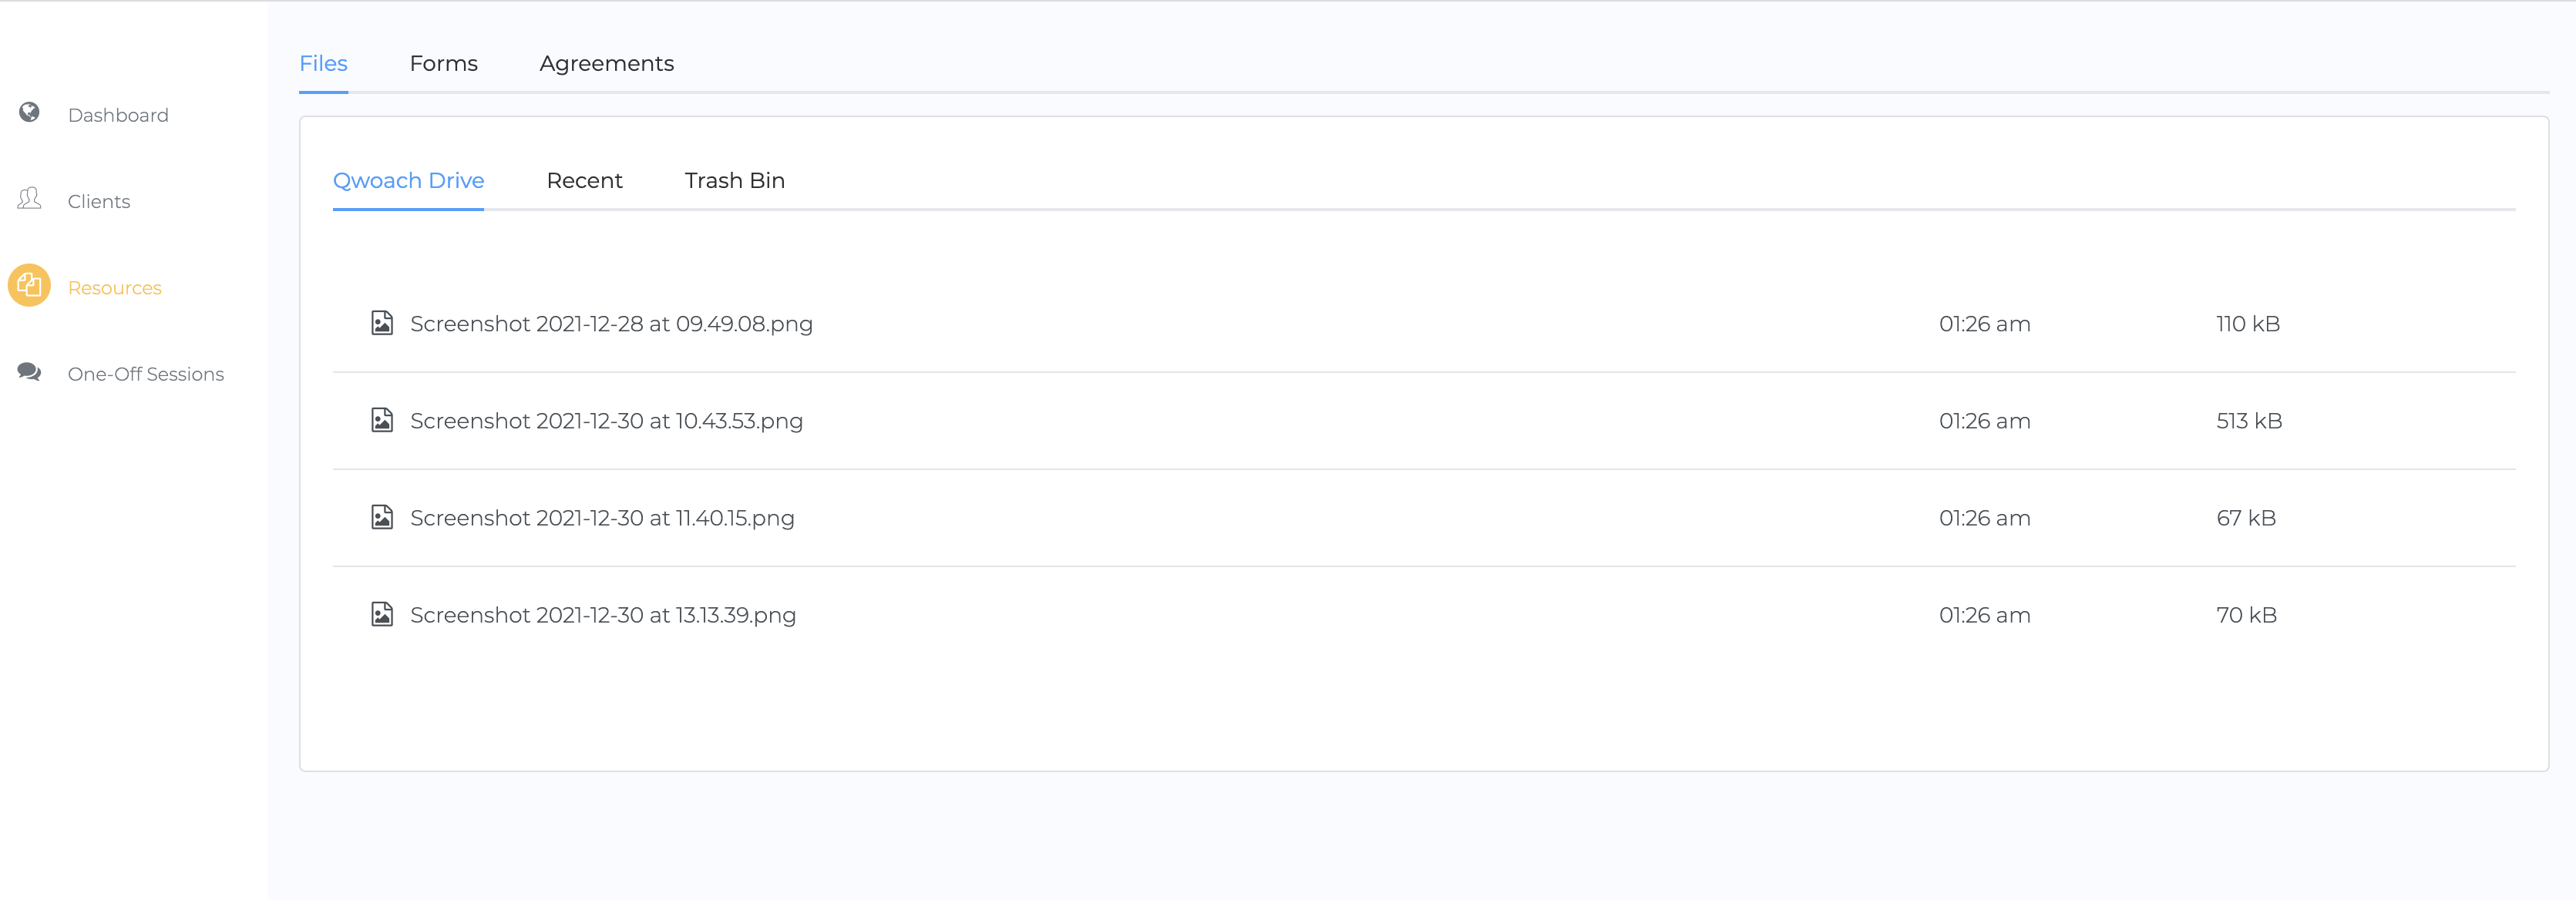
Store All of Your Files in One Secure Place
It's Like Google Drive, But Built For Practitioners
Share video recordings, audio files, notes, images. All in a secure private space.
No Matter How Big or Small.
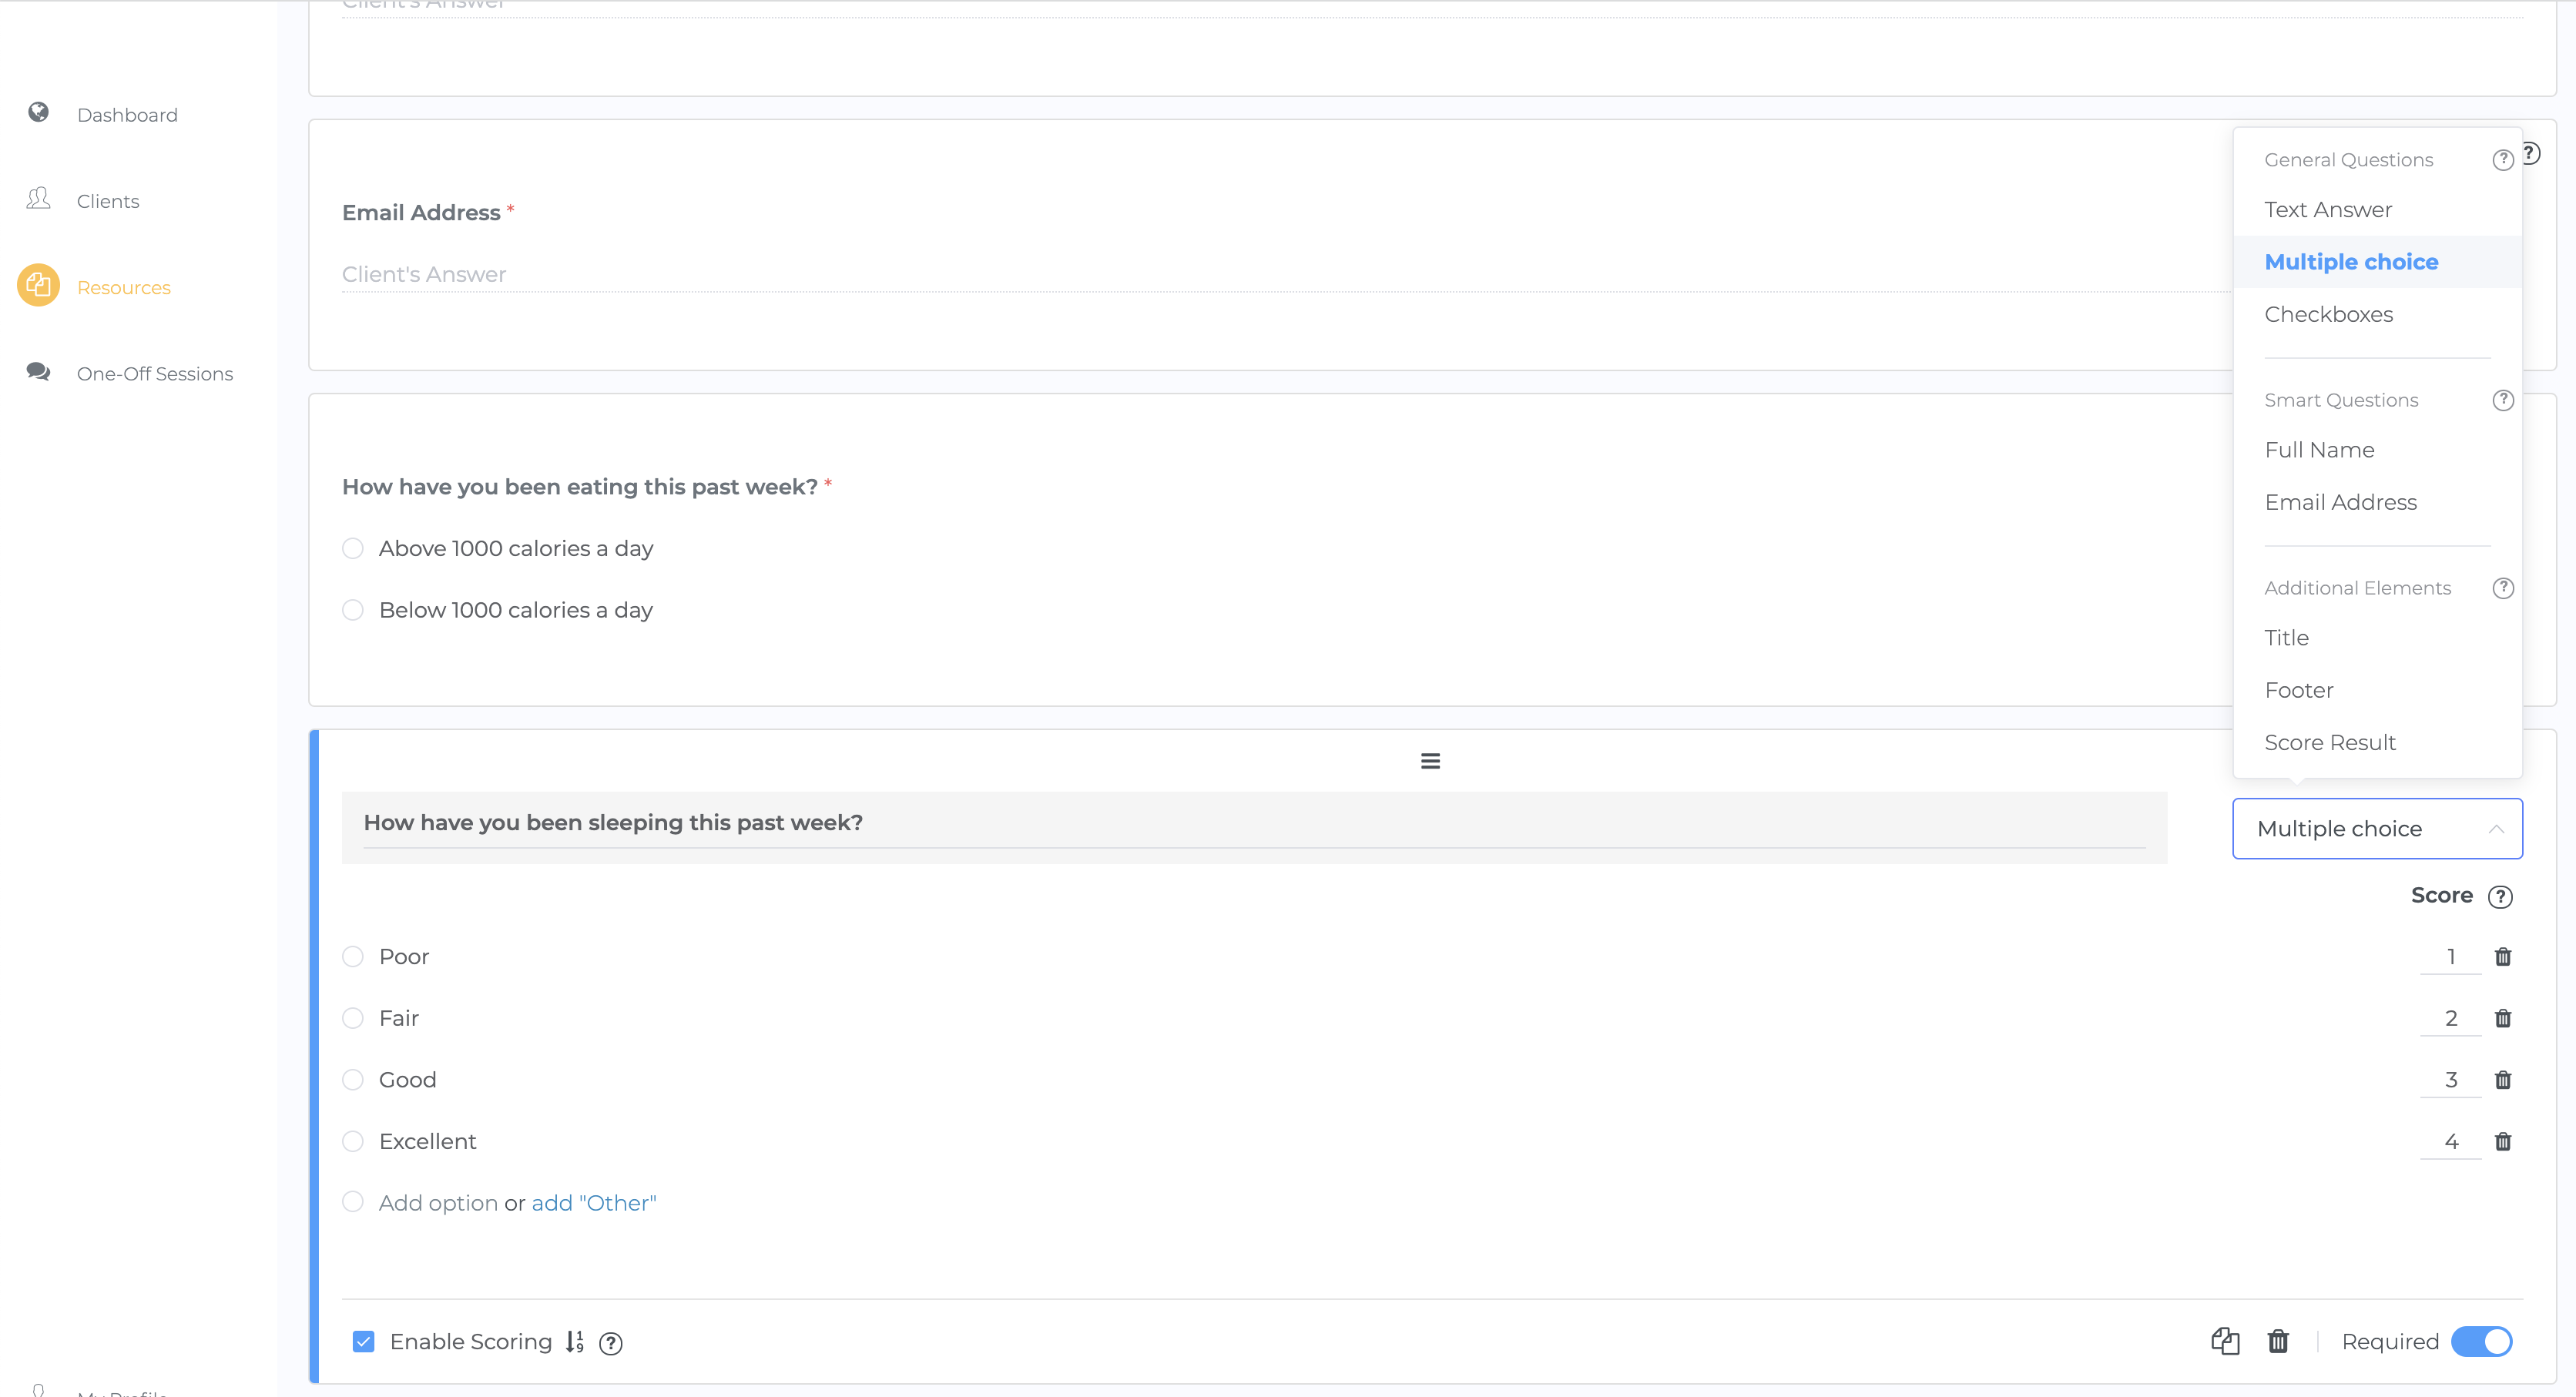
Share In-Take Forms and Questionnaires
It's like Google Forms But Built For Practitioners
Select from multiple question types, like text answer, checkboxes, single answer etc
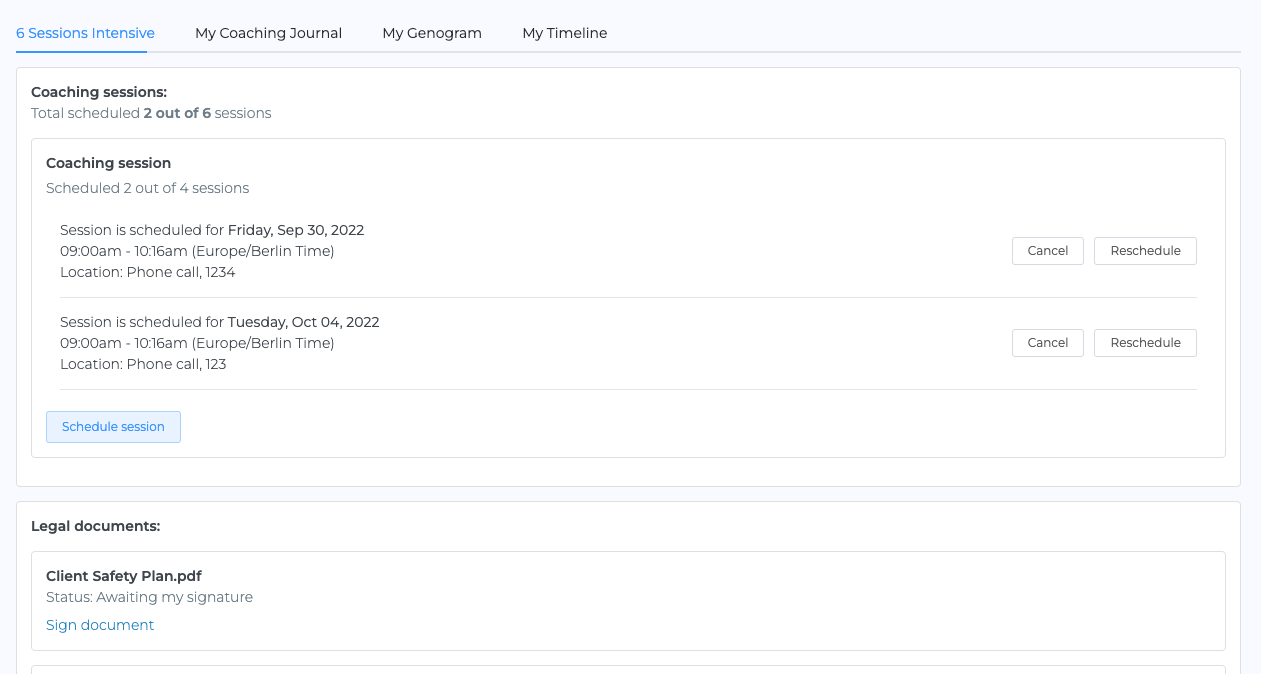
Personal secure portal for your clients.
Your client can easily keep track of their sessions, sign legal documents, and access all the materials you share with them.

Make Qwoach your own.
With your Custom Branding.
Add Qwoach to your website in under 10 minutes and let your clients access their portal right under your brand.
On both desktop and mobile devices.
No app installations. No Qwoach logos. No extra setup fees.
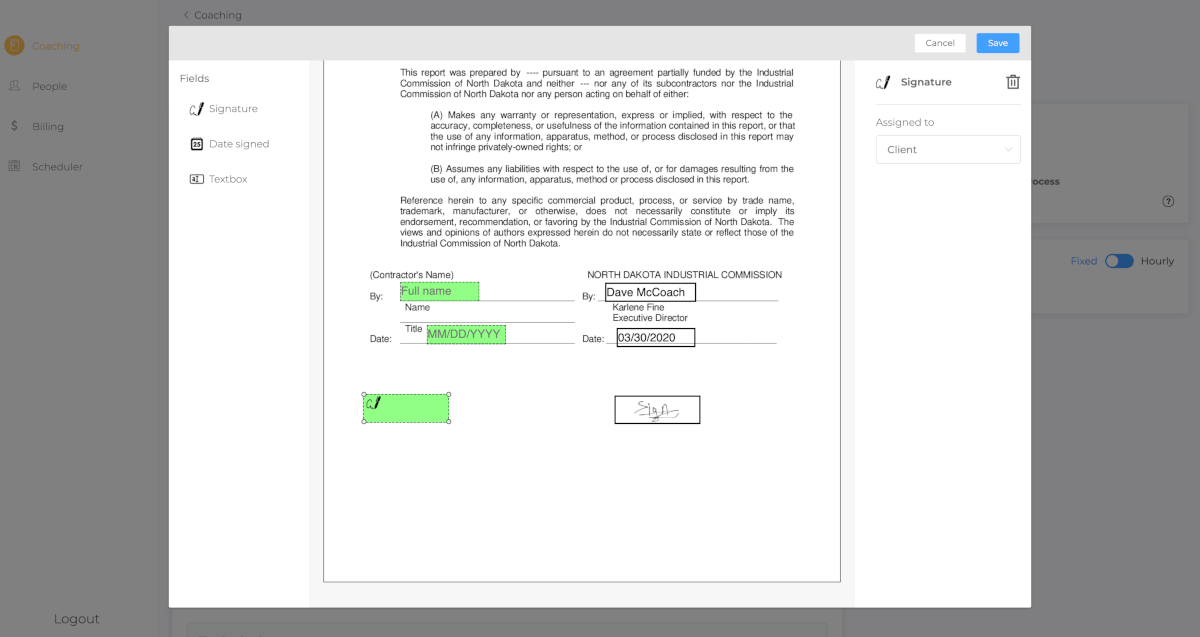
In-house Secure Legal docs Management.
Securely manage all of your legal docs in one place.
Request signature from your client with a single click and let them sign it right from their inbox.
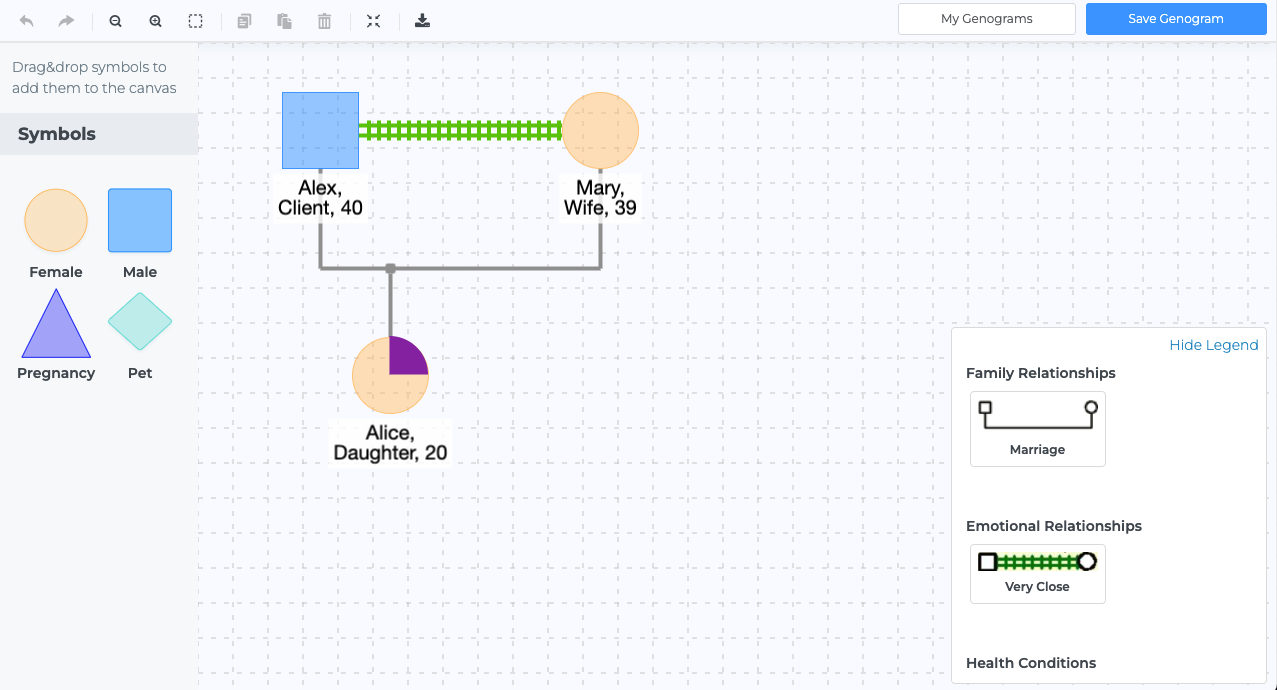
Interactive Genogram Builder
Our ClarityTrack™ System by EasyGenogram allows you to scaffold the entire tree and uncover toxic patters in a fraction of time needed using other methods.
Dynamic templates allows to map portions of a family tree with just a few clicks.
Comprehensive library of more than 60 emotional and family connections allow to map family dynamics of any complexity.
Starter
Free
White-labeling
Custom features development
Group Packages
Scheduling
Billing & Payments
Online Classes
Digital Downloads
Client Management
Automated Messaging
File Sharing
Contract Signing
Questionnaires & Worksheets
Subscriptions
Payment Plans
Wheel of Life
Popular
Personal Touch
$ 29
White-labeling
Custom features development
Group Packages
Scheduling
Billing & Payments
Online Classes
Digital Downloads
Client Management
Automated Messaging
File Sharing
Contract Signing
Questionnaires & Worksheets
Subscriptions
Payment Plans
Wheel of Life
Ultimate
$ 49
White-labeling
Custom features development
Unlimited Group Packages
Scheduling
Billing & Payments
Online Classes
Digital Downloads
Client Management
Automated Messaging
File Sharing
Contract Signing
Questionnaires & Worksheets
Subscriptions
Payment Plans
Wheel of Life